
Meta ads management for eCommerce brands
Facebook and Instagram run against contribution margin rather than against the ROAS the platform reports. Most accounts we take over are not short of budget, they are short of creative the algorithm has anything to choose between.

Loading Meta Ads hero image

What’s included in Meta Ads
Facebook and Instagram campaign management
Account structure, campaign objectives, budgets and the weekly decisions underneath them. Facebook and Instagram share an auction and a catalogue, so they are managed as one account with placements chosen per creative rather than as two channels with separate plans.
- Campaign, ad set and ad structure built around one objective each
- Placement strategy across feeds, Reels, Stories and Advantage+ placements
- Budget pacing and the discipline not to reset learning every week

Advantage+ shopping campaigns
Meta's automated shopping campaigns work when they are given a clean signal, a real creative pool and a sensible existing-customer budget cap, and waste money quietly when they are not. We run them as one part of an account rather than as the whole of it, and we keep enough manual structure to know what is actually working.
- Advantage+ set up against the right conversion event and value rules
- Existing-customer budget caps so prospecting money is not spent on repeat buyers
- A manual structure alongside it, so the account still produces readable answers

Catalogue and dynamic product ads
For an eCommerce brand the catalogue is half the account. Titles, images, availability, price and product sets decide what dynamic ads can show and to whom, and most catalogues are the untouched export from a store platform. Fixing the feed usually moves more than any bid change available.
- Catalogue setup, diagnostics and error clearing in Commerce Manager
- Product sets for prospecting, retargeting, bestsellers and clearance
- Feed titles, imagery and availability kept in step with the store

Creative strategy and testing
Creative is the targeting now. We plan against angles rather than assets: the problem the product solves, the objection that stops the purchase, the proof that answers it, then the formats that carry each one. Winners are iterated rather than replaced, which is the difference between a testing programme and a treadmill.
- Angle and hook planning from reviews, support tickets and search terms
- Static, video, UGC and Reels formats produced against those angles
- Structured testing that reads results at the ad level, not the account level
Audience and retargeting strategy
Broad prospecting with a good signal, lookalikes where they still earn their place, and retargeting sized to the traffic that exists rather than to a percentage somebody read in a blog post. Over-spending on retargeting is the commonest way an account reports a good ROAS while the business grows more slowly than it should.
- Broad, interest and lookalike prospecting tested against each other
- Retargeting windows and exclusions that stop paying for buyers you already have
- Customer lists and value-based audiences where the data supports them

Conversions API and event quality
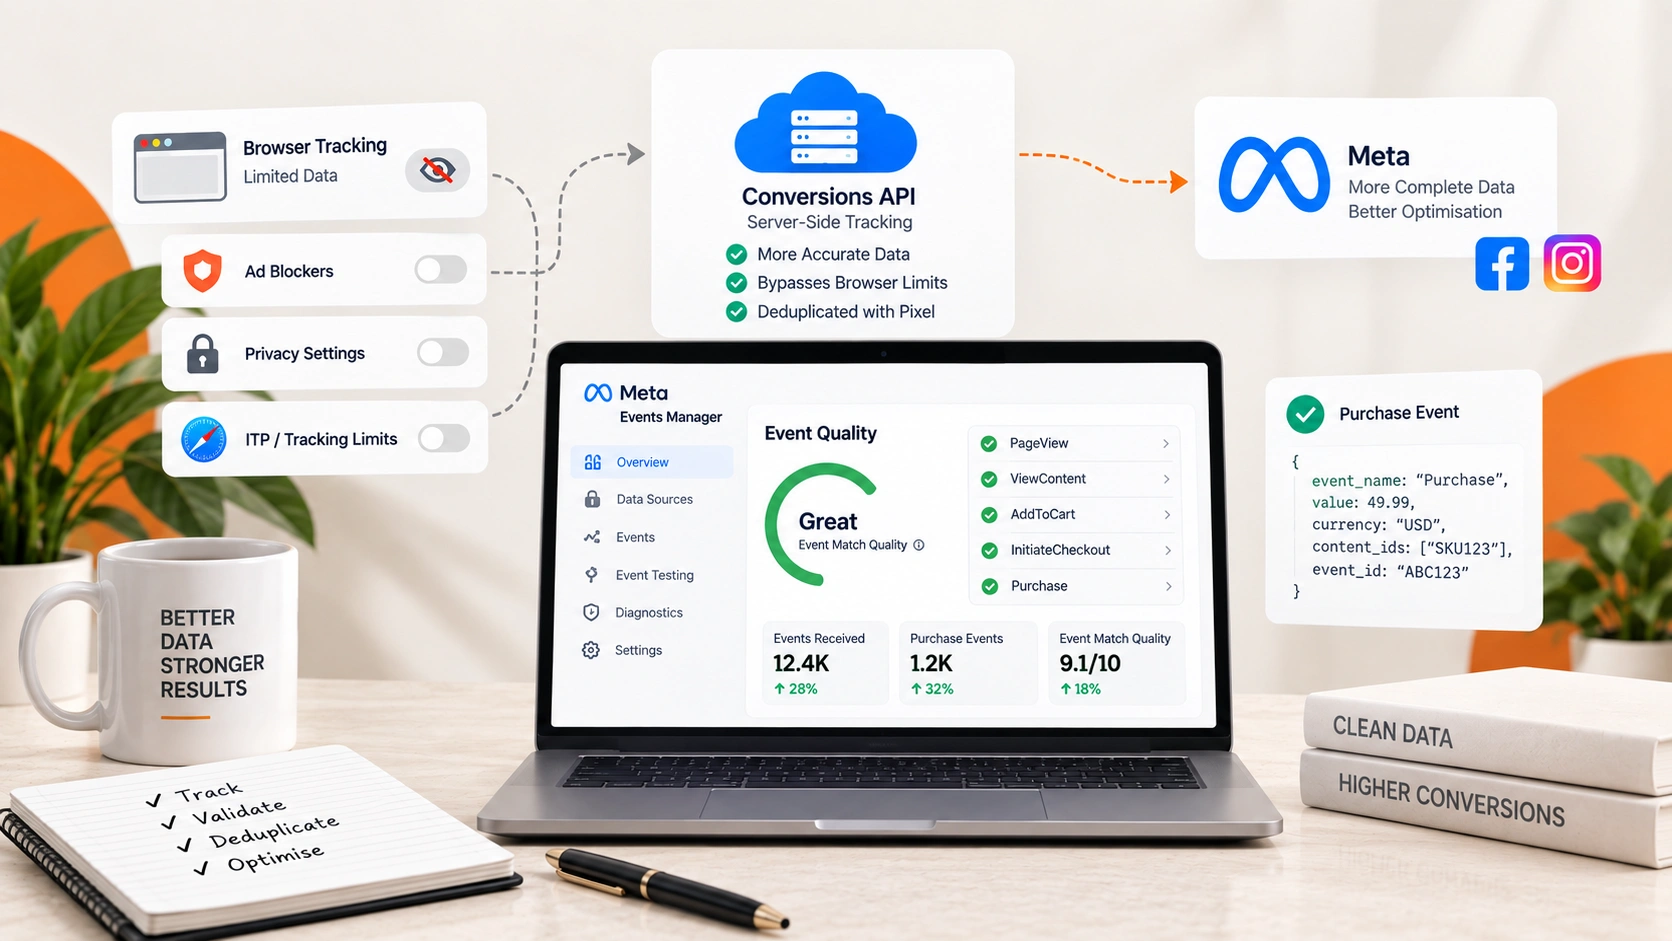
Browser tracking alone loses a material share of events to blockers and privacy settings, and everything the platform optimises towards is downstream of what it can see. Conversions API, correct event parameters and deduplication are ordinary maintenance work now, not a project.
- Conversions API set up server-side and deduplicated against the pixel
- Event match quality raised with the parameters the platform actually uses
- Purchase values, currency and content ids checked against the store's own orders
Measurement and attribution
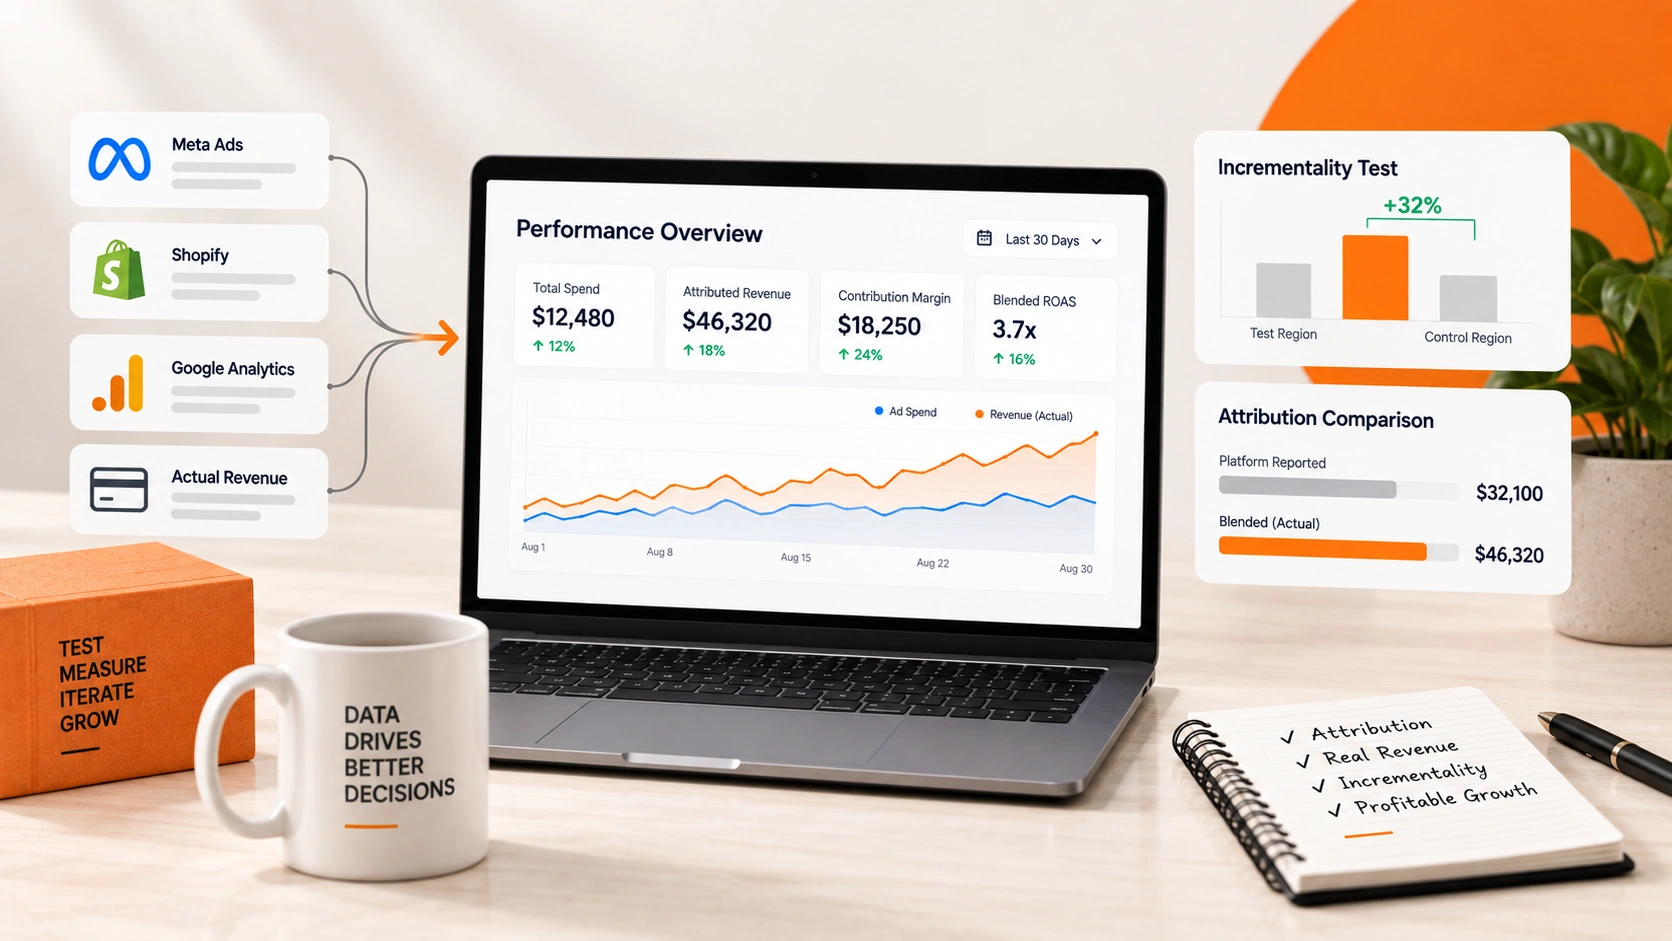
Platform-reported ROAS and the revenue in the accounts rarely agree, and the gap is not a fault to be fixed so much as a difference to be understood. We report against contribution margin and blended results, and use incrementality tests rather than arguments when a channel's real contribution is in question.
- Attribution settings and reporting windows chosen deliberately, not left at default
- Blended reporting that ties spend to what the business actually banked
- Holdout and geo tests when the question is whether the spend is incremental
Instagram advertising
Same account, different room. Feed, Stories, Reels and Explore each reward a different edit of the same idea, and the commonest waste on Instagram is a square static asset stretched across placements it was never made for.
- Placement-native edits rather than one asset resized
- Reels-first creative for the placements where the impressions are
- Creator and partnership ads run through the brand's own account

Creator and partnership ads
Running a creator's post as an ad from their handle carries the credibility their audience already gave them. It needs permissions, tracking and a rights window agreed up front, which is where most of these arrangements go wrong.
- Partnership ad permissions and rights windows agreed before the spend
- Creator content tested against brand-produced creative on equal terms
- Whitelisting managed without handing anybody the ad account

Landing page and post-click work
An ad account can only sell what the page converts. Where the drop-off is after the click, the fix is on the site: page speed, the offer's clarity, the delivery promise and the checkout. We say so rather than raising bids into a page that is losing the visit.
- Landing page and product page review against the ad's promise
- Speed and mobile checkout problems named with the fix
- Offer and delivery messaging tested where it decides the conversion

Account audit and takeover
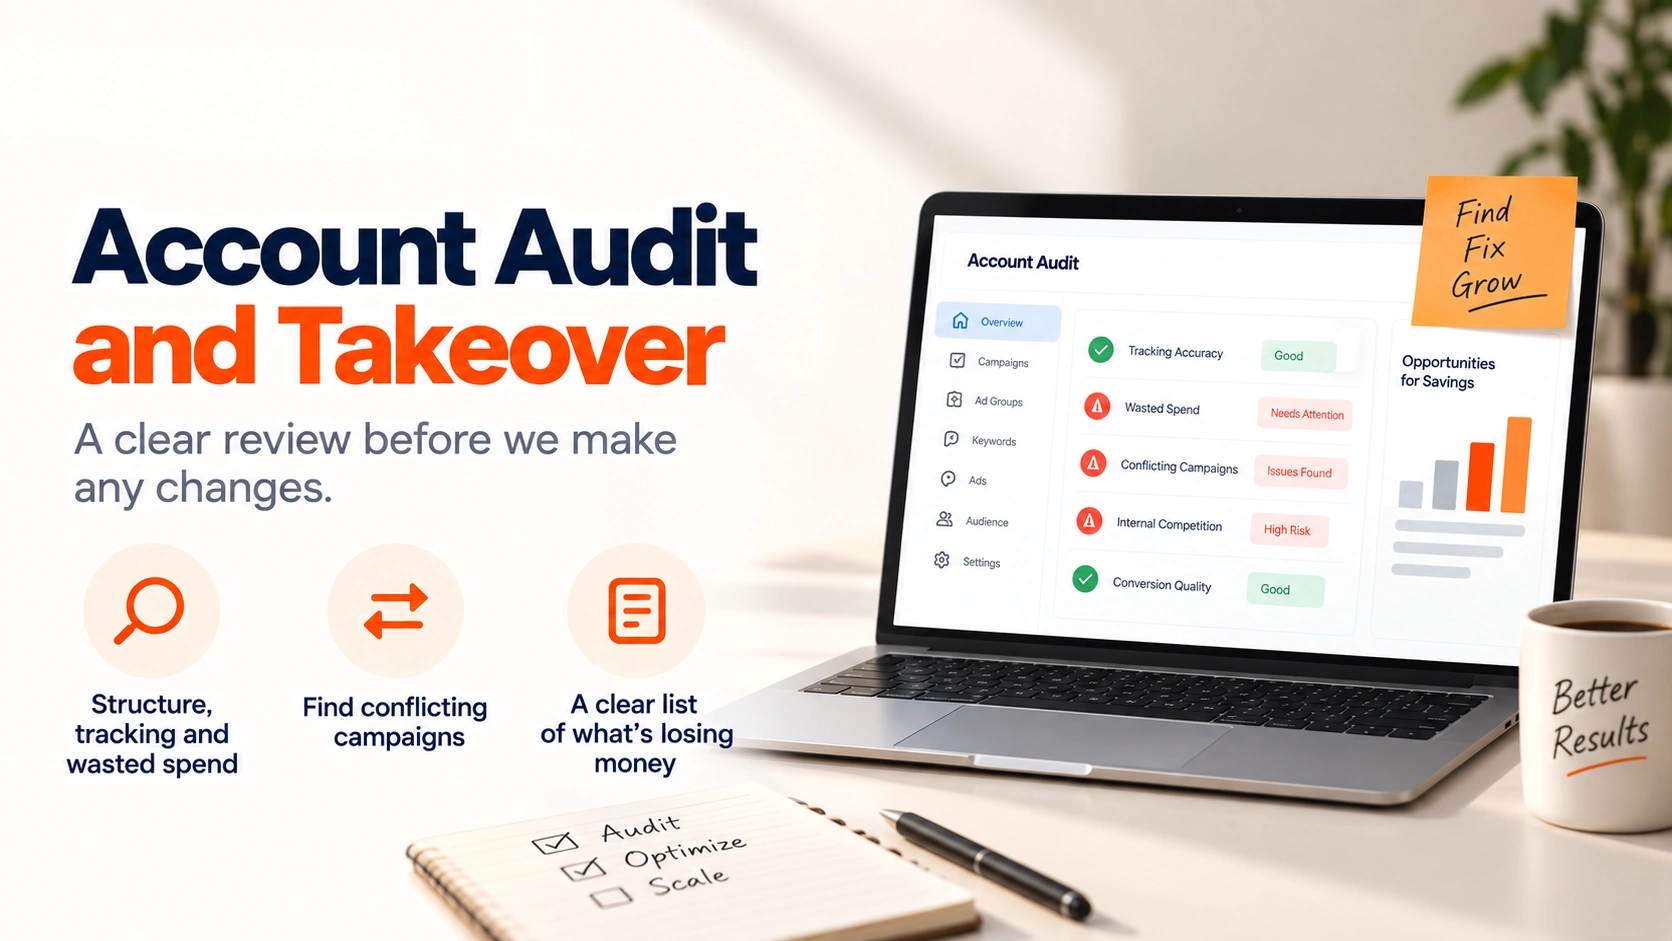
Every engagement starts with reading the account rather than rebuilding it. Structure, signal, creative history, audience overlap and what was already tested, so the first month spends its energy on what is wrong rather than on rediscovering what the last team already learned.
- Structure, spend distribution and creative history read in full
- Event and catalogue health checked before any budget moves
- A written plan of what changes first, and what is deliberately left alone

Reporting on profit, not platform metrics
A dashboard that reports ROAS and nothing else can look excellent while a business loses money on every order. Reporting starts from contribution margin after cost of goods, fees, shipping and returns, and the platform's own numbers are context rather than the verdict.
- Contribution margin by campaign and by product set
- Blended acquisition cost reported beside the platform's figure
- One monthly view a founder can read without a translator

How it works
- 01
Audit the account and the signal
Structure, spend distribution, creative history, audience overlap, catalogue health and the quality of the events being sent. Signal comes first because everything the platform optimises towards rests on it, and a surprising number of accounts are buying conversions that fire on the wrong page or count the same order twice.
- 02
Fix what is losing money quietly
Overlapping audiences bidding against each other, retargeting sized for traffic that does not exist, Advantage+ campaigns spending prospecting budget on existing customers, catalogue errors hiding half the range. This is usually where the first month pays for itself.
- 03
Rebuild the structure around one question each
A campaign that answers two questions answers neither. Prospecting, retargeting and existing-customer work are separated so the account can be read, and consolidated where separation was only splitting the data too thin to learn from.
- 04
Build the creative pipeline
Angles from reviews, support tickets and search terms, then enough formats against each to give the auction a real choice. Volume matters, but volume of variations on one idea is not the same as volume of ideas, and only the second reliably finds a new winner.
- 05
Test, read and iterate weekly
Results are read at the ad level against contribution margin, winners are iterated rather than retired, and losers are stopped before they teach the algorithm the wrong lesson. Changes are paced so learning is not reset every Monday.
- 06
Report on what the business banked
Contribution margin, blended acquisition cost and the platform's own figure side by side, with what changed, what it did, and what is being tested next. No metric is reported that nobody can act on.
How the fee works
What you would pay
Drag the slider, use the arrows or type an exact figure.
Estimated monthly service fee
$3,150/month
- Base fee
- $1,100
- Performance fee
- $2,050
- 1
$1,500/month flat while monthly sales are up to $20K
- 2
Above $20K, $1,100/month base plus a performance fee on your topline sales
- 3
Performance fee capped at $50,000/month; the base fee continues on top
At $80,000 in monthly sales, the estimated fee is $3,150 a month: a $1,100 base fee plus a $2,050 performance fee.
Frequently asked questions
Other services we offer
- Conversion Rate Optimization
Conversion Rate Optimization
Conversion rate optimisation for eCommerce: funnel analysis, page and offer work, checkout friction and testing that reaches a decision.
Learn More - Creative & Media
Creative & Media
Marketplace creative built to convert: listing images, main image CTR testing, A+ and Premium A+ content, Brand Stores, packaging and advertising design.
Learn More - Google Ads
Google Ads
Google Ads management for eCommerce: Search, Shopping, Performance Max and feed optimisation, run against contribution margin rather than platform ROAS.
Learn More
Guides on Meta Ads
What we have written about the work, for anybody weighing it up before they ask us.



Loading case studies