eCommerce Conversion Rate Optimization: Find the Step That Loses Shoppers, Then Test the Fix
A store with traffic and few orders usually has one step where most shoppers leave. How to find it in the funnel report once the sessions are human, what each step usually points at, how to turn a belief into a testable change, and how to read the result honestly.


Loading Article banner
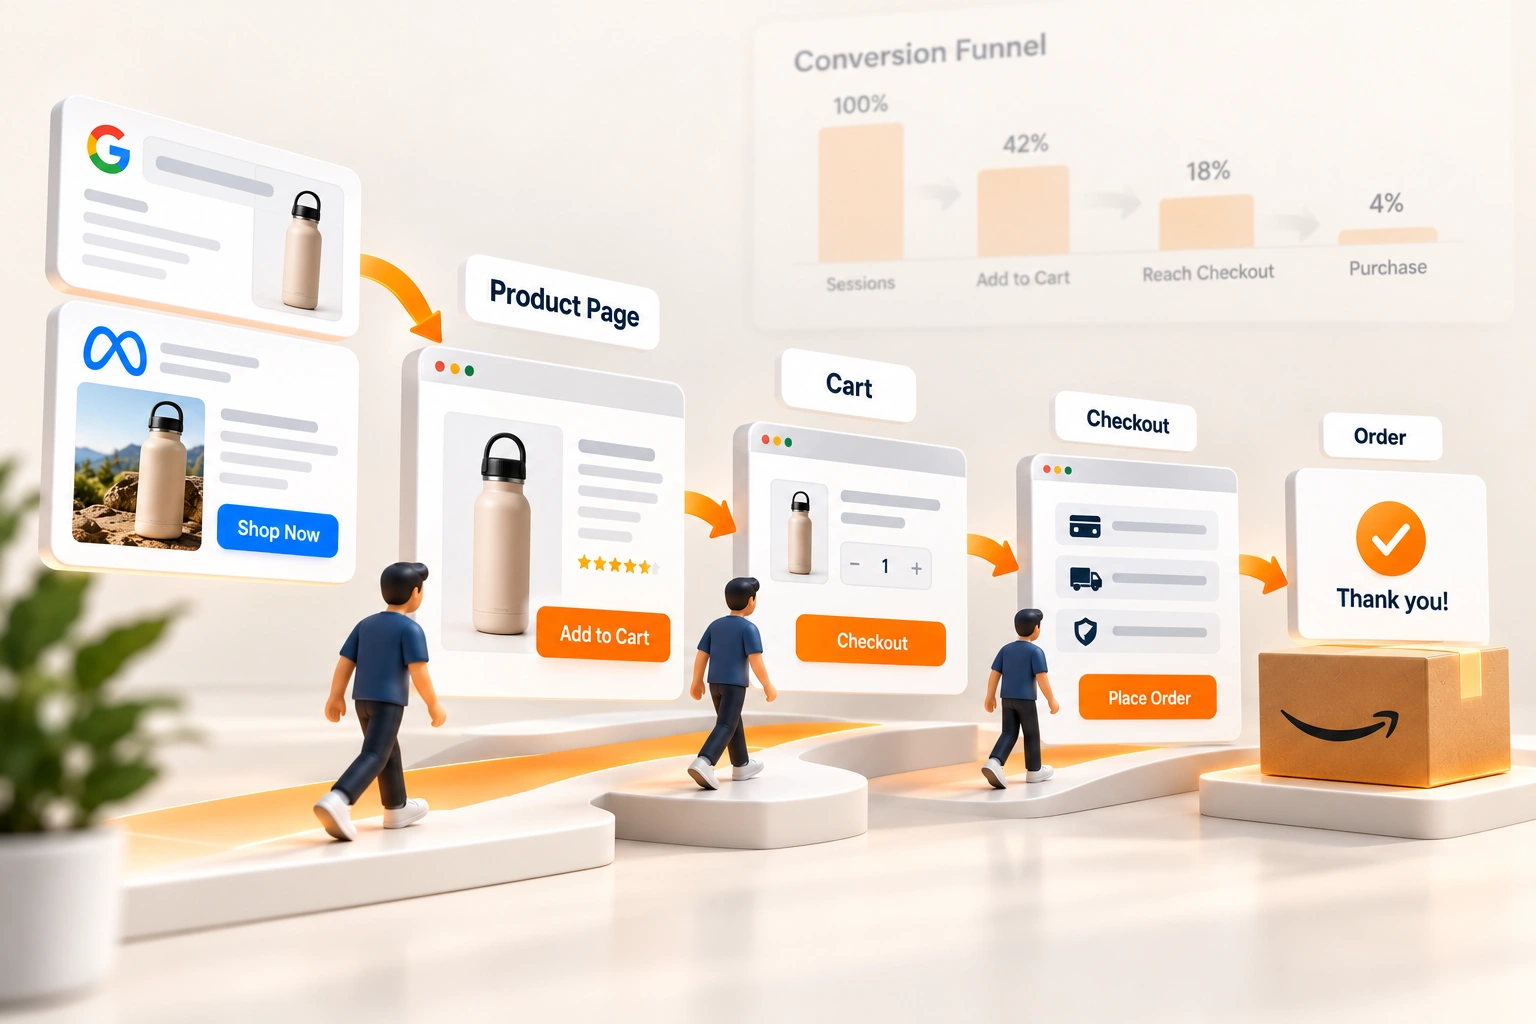
A store with traffic and few orders usually has one step where most of its shoppers leave, and an owner changing everything except that step. Conversion rate optimization is the discipline of finding it, changing one thing about it, and finding out honestly whether the change worked.
Each job fails in its own way: the wrong step is chosen because the numbers were never split, the change is a redesign nobody can attribute, or the result is read before it means anything. This is the method, with Shopify's reports as the example and the deeper guide to each part.
Count the shoppers before the sessions
Every rate below is divided by sessions, so the sessions have to be people. On 21 September 2026 Shopify changed how its analytics count them, focusing the default view on human visitors and classifying bot and system traffic more consistently. Its changelog warns that "sessions, conversion rate, and other session-based metrics might look different after this update", and that orders, sales and customer counts "aren't changed".
Two things follow. A conversion rate from before that date and one from after it are not the same measure, so the baseline starts afterwards. And a store whose sessions were mostly bots has a traffic problem before it has a conversion one; traffic but no sales, bot sessions or a store problem is how to tell which.
Find the step that loses the most shoppers
Shopify's conversion rate breakdown report draws the funnel in four stages: all sessions, sessions with cart additions, sessions that reached checkout, and sessions that completed checkout. Reached checkout means sessions "where there was user input (for example, a key press or mouse click) during checkout", not a page that merely loaded.
Three ratios come out of it. The added to cart rate is "sessions with cart additions / sessions". The step from cart to checkout is the sessions that reached checkout over the sessions with cart additions. And the checkout conversion rate is "sessions that completed checkout / sessions that reached checkout". In the stores we work on, the largest drop on the chart is almost always the first, and that alone does not make it the problem.
What makes a step the problem is comparison, and we make three. The store against its own recent months, at the same season. Each step split by device, because a checkout that works on a laptop and fails on a phone hides inside a healthy average. And each step split by where the visit came from and where it landed, because a paid social visitor on the home page and a returning customer on a product page are two funnels drawn as one. The step that has fallen, or that one group of shoppers fails at, is the one to work on.
What each step usually points at
Our reading, from the stores we work on: each is a place to look, not a verdict.
Visit to cart. The product page and the offer: whether visitors landed where the ad or the post promised, whether the images and words answer what a buyer of this product asks, and whether the price holds up beside the alternatives. Speed belongs here too. Google's web.dev puts a good page at a Largest Contentful Paint within 2.5 seconds, an Interaction to Next Paint of 200 milliseconds or less and a Cumulative Layout Shift of 0.1 or less, measured at the 75th percentile of page loads on mobile and on desktop.
Cart to checkout. Often a shopper who added to compare, or one who met a cost or a delivery date in the cart they did not expect. A cart that shows shipping as calculated at checkout moves the surprise one step later rather than removing it.
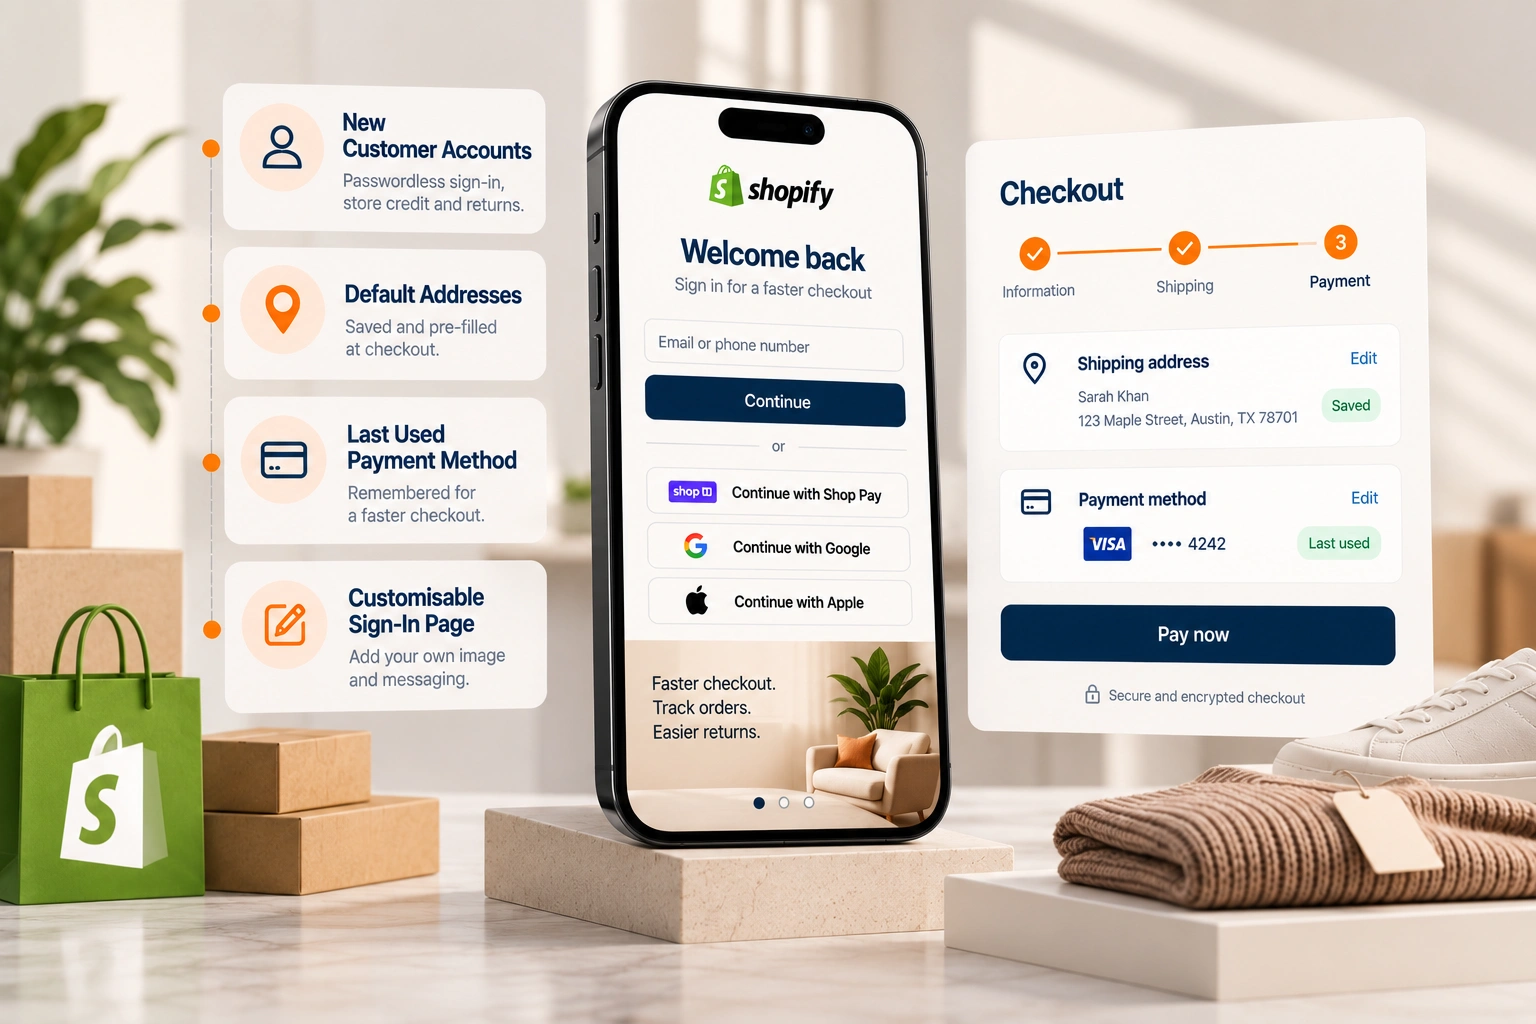
Checkout to order. The cost, the effort and the trust. Baymard Institute, a research firm that gathers published studies of cart abandonment, puts the documented average abandonment rate at 70.22 per cent across 50 studies. Its own survey of US online shoppers' reasons for abandoning a checkout is led by extra costs, such as shipping, tax and fees, and also lists being made to create an account and a checkout that is too long or complicated. For a store with repeat buyers, Shopify's 2026 checkout changes for signed-in customers shorten exactly this step.
Repair what is broken, test what is a belief
Not every finding needs a test. A broken link, a page that misses the speed thresholds, a shipping cost hidden until the last screen, a payment method the store's market expects and the store lacks: these are repairs, and testing them spends the traffic a real test needs.
A belief is different. A new product page layout, a different order of information above the fold, a free shipping threshold, a bundle. Somebody thinks it will help and nobody knows. Those are the changes worth testing, one at a time.
Write the change as a hypothesis
Before anything is built, the change is written in one sentence that names the evidence, the change, the step it should move and the number that must not fall. For example: because visitors from paid social land on the home page and leave before adding to cart, sending them to the product they saw will raise the added to cart rate for that traffic without lowering revenue per session.
Then the stopping rule, written down before the start: the number of orders each version needs before anybody reads the result, not a number of days. A change that cannot be written this way is not ready to test, and usually means the step has not been found yet.
Screen the idea, then test it with real shoppers
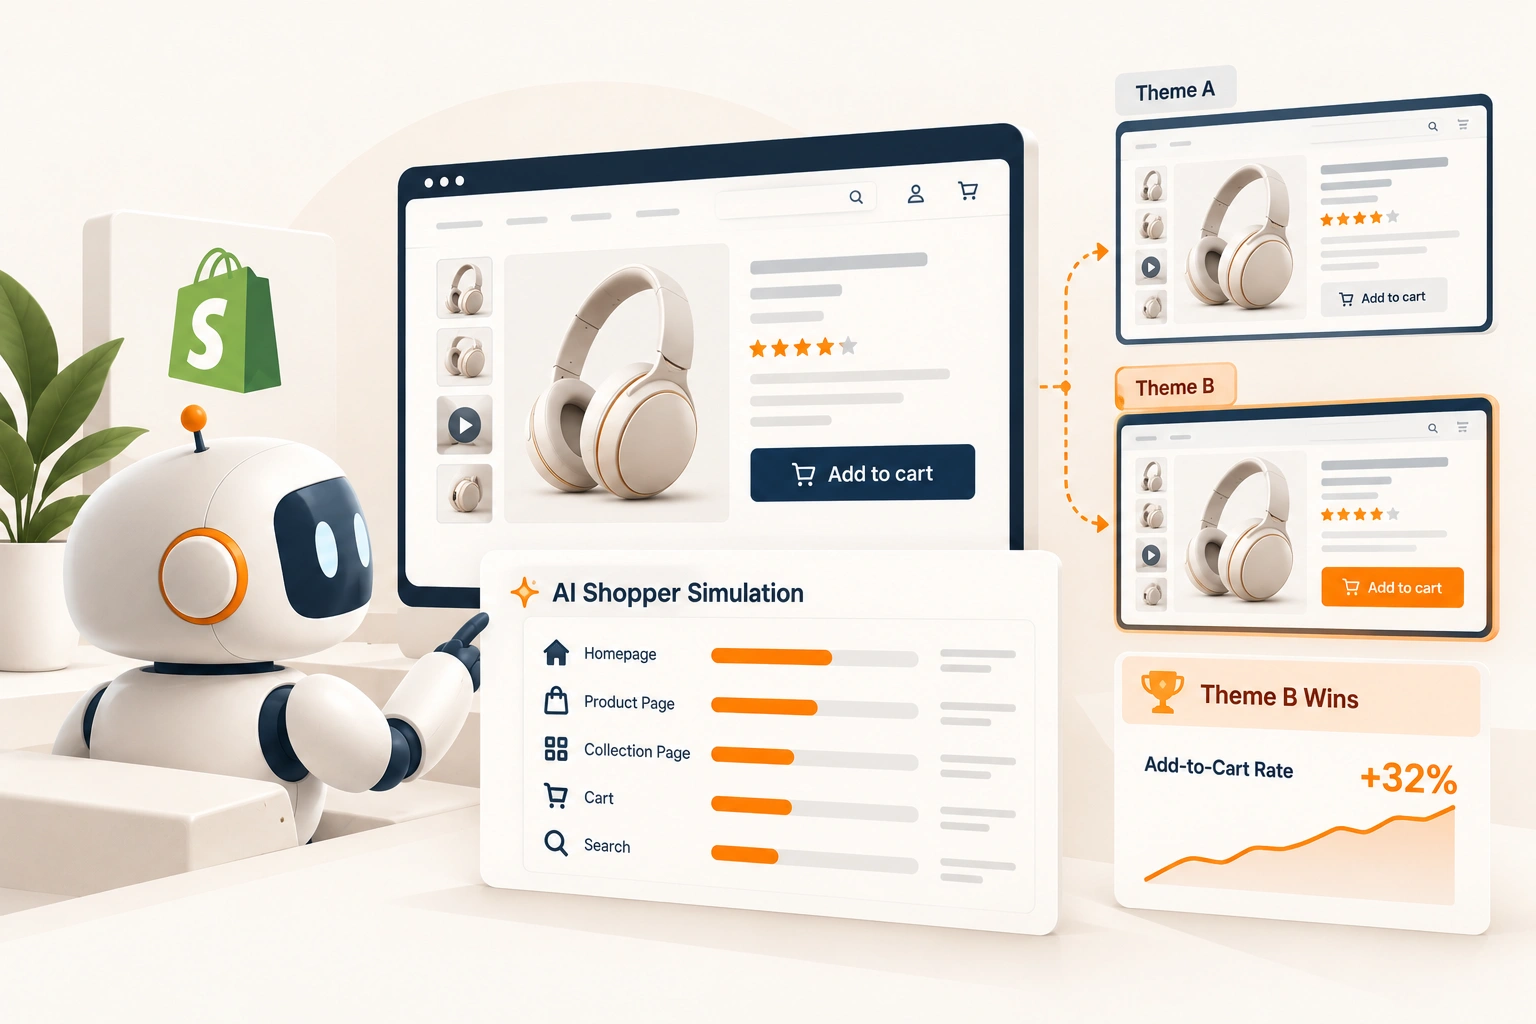
A simulated shopper can rule out a weak idea cheaply. Shopify's SimGym sends AI shoppers through two themes and reports "whether the AI shoppers were more likely to add to cart on one of the themes", and Shopify's help page cautions that "results might differ from how your actual customers behave." What SimGym can tell you before a real test covers where it helps and where it stops, which is at the cart.
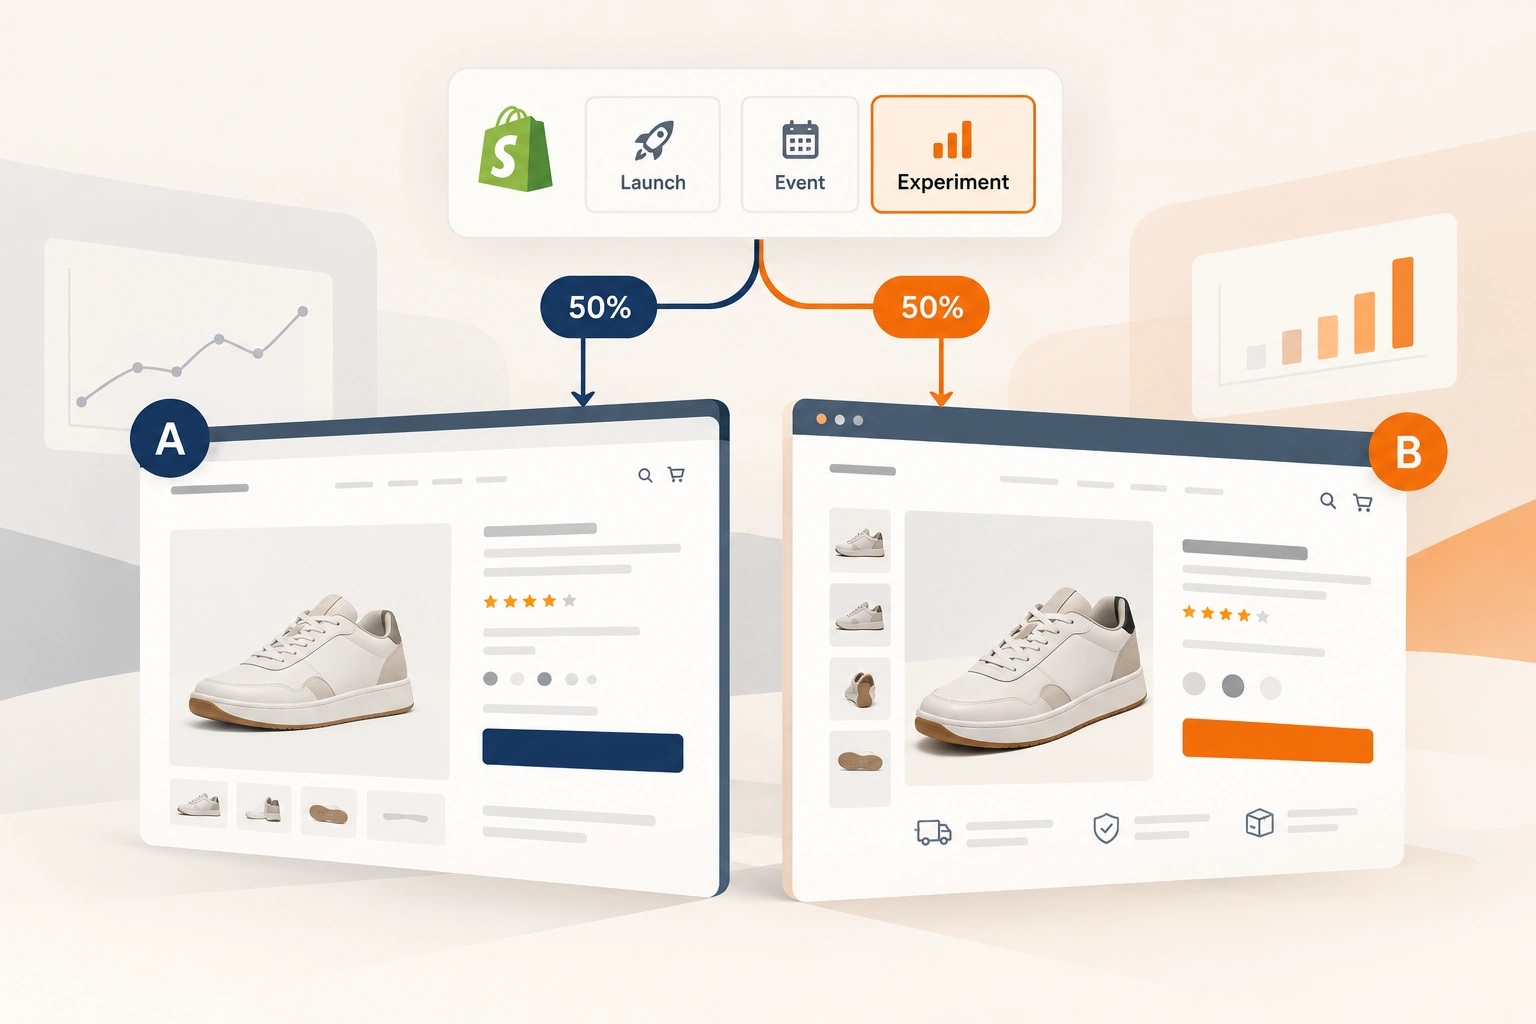
Real shoppers make the decision. On Shopify, Rollouts runs it: "An Experiment compares a treatment against a control so that you can measure the impact of changes before a full Launch", and because both versions run in the same weeks, a sale or a quiet fortnight lands on each alike. Running a Shopify Rollouts test that gives an honest answer sets out the setup. A brand that also sells on Amazon has the same discipline there, where Manage Your Experiments splits a listing's shoppers between two versions.
Read the result honestly
Four rules, from our practice.
Wait for the stopping rule. A result read early is a few days of noise, and it is usually more dramatic than the truth.
Read the whole funnel. A change that lifts the conversion rate and lowers the average order value may have moved revenue the wrong way, so revenue per session is the guard number.
One change per test. Two changes in one test show that the pair moved the number and nothing about which half did it.
Record every result. A flat result is an answer: the belief was wrong or too small to matter, and the next test goes elsewhere. Shopify's help page says a finished rollout's analytics can be reviewed "to compare it to your live store", and does not say it reports significance, so the stopping rule is the store's own.
When a store is too small to test
A store with a few orders a week cannot reach a stopping rule in useful time, and that is no reason to change things on opinion. It makes the repairs, which need no test, reads customers' questions and reviews for the reasons people hesitate, screens ideas with a simulation where one fits, and makes one dated change at a time, so that a before and after reading, the weakest kind, is at least a clean one.
Where we fit
Finding the step that loses the most shoppers, and testing one change to it until the answer is honest, is how we run conversion rate optimization for online stores. If the funnel report has never been split by device and landing page, that is where we would begin.
Frequently asked questions
The questions that come up most often on this subject.
The work of raising the share of a store's visits that end in an order, without buying more traffic. It means finding the step where most shoppers leave, from landing to cart, checkout and payment, changing one thing about that step, and measuring the result against a control with real shoppers before the change is kept.
Open the funnel report, which on Shopify is the conversion rate breakdown, and read each step against the store's own recent months, then split it by device and by landing page or traffic source. The step that has fallen, or that one group of shoppers fails at, is the first candidate. Count human sessions only: Shopify changed how it counts them on 21 September 2026.
In one sentence that names the evidence, the single change, the step it should move and the number that must not fall, such as revenue per session. Then add the stopping rule before the test starts: how many orders each version needs before the result is read. If the sentence cannot be written, the step causing the loss has usually not been found yet.
Only slowly. A test needs enough orders in each version to be read, so a store with a few orders a week may wait months for an answer. Until then, make the repairs that need no test, read customer questions and reviews for the reasons people hesitate, screen ideas with a simulation if one fits the store, and make one dated change at a time.
Because the conversion rate counts orders, not their size. A cheaper offer, a deeper discount or a change that steers shoppers to the smallest option can raise the share of sessions that buy and lower the average order value by more. That is why a test is read on revenue per session as well as the conversion rate, across the whole funnel.