ACoS, TACoS and ROAS: What Each One Answers
Three ratios, three different questions, and an account judged on the wrong one will optimise itself into a smaller business.


Loading Article banner
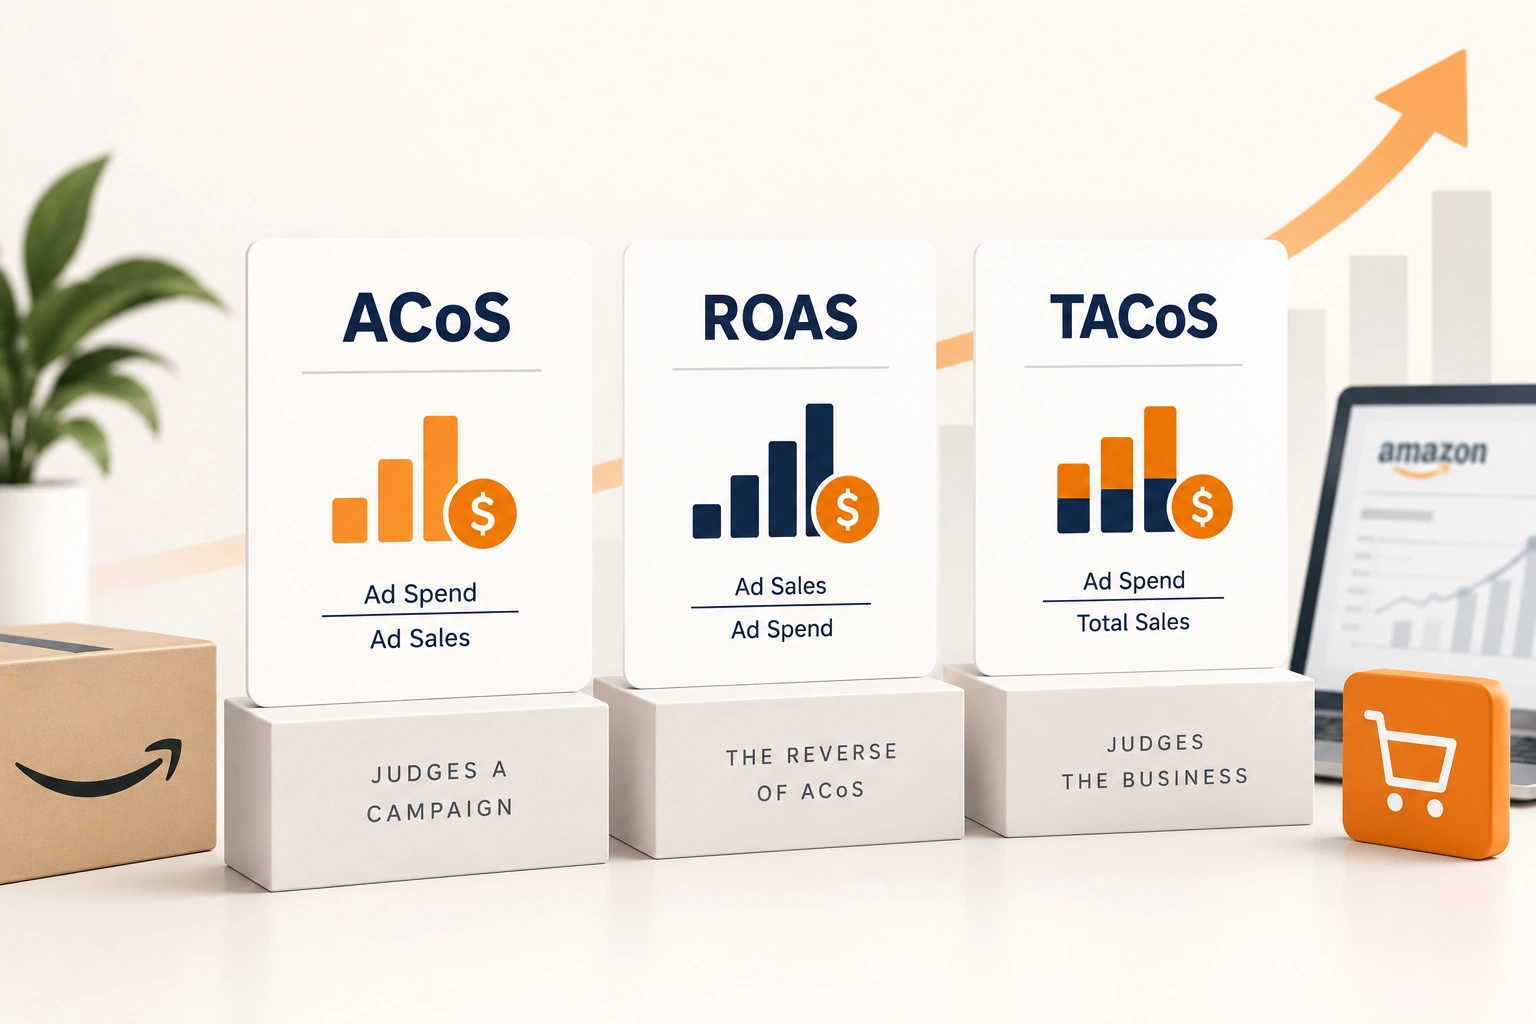
Three ratios get quoted interchangeably in Amazon accounts and they answer different questions. Using the wrong one is not a reporting problem, it is a strategy problem, because whichever number is on the dashboard is the number the account gets optimised towards.
The short version: ACoS judges a campaign, TACoS judges the business, and ROAS is ACoS the other way up for people who came from other channels.
ACoS: advertising cost of sale
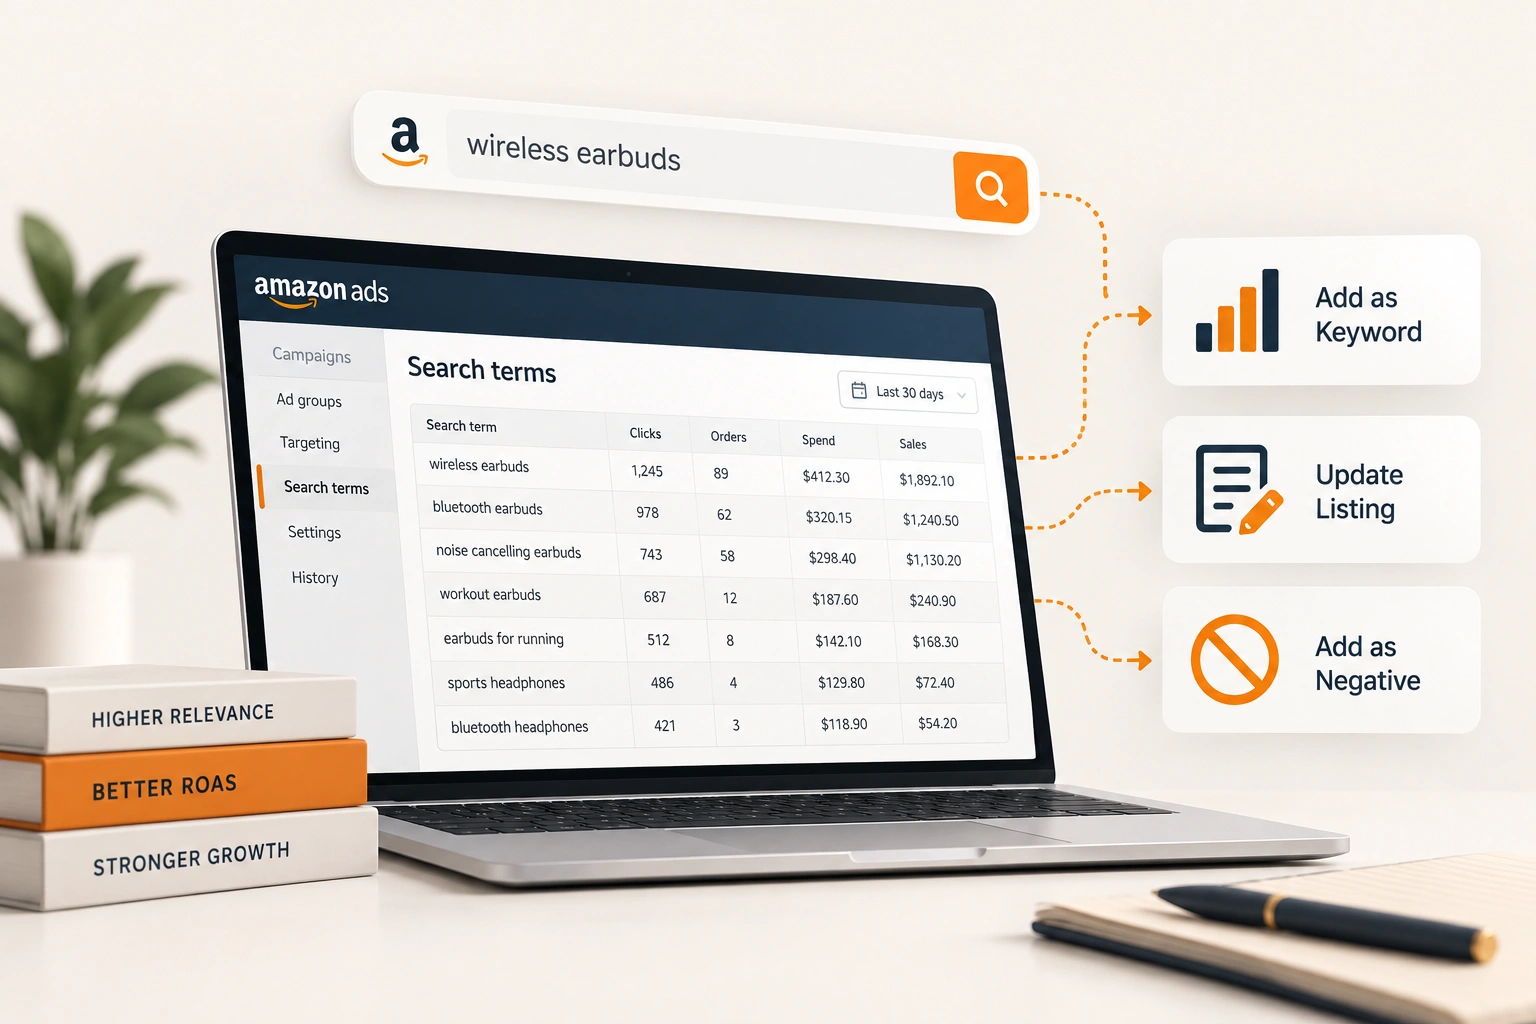
Ad spend divided by the sales that advertising produced. It answers whether a campaign paid for itself, and only that.
It is the right number for a bid decision and the wrong one for a budget decision, because it takes no account of the organic sales the advertising caused. A campaign at 40% ACoS that lifts a listing into the first page has done something the ratio cannot see.
ROAS: return on ad spend
Sales divided by spend, which is the reciprocal of ACoS. A 25% ACoS is a 4x ROAS, and neither says anything the other does not.
It exists on Amazon because everybody arriving from Google and Meta thinks in ROAS. Pick one and use it consistently; using both is how two people in a meeting disagree about an account they both understand.
TACoS: total advertising cost of sale
Ad spend divided by total sales, organic included. It is the only one of the three that says whether advertising is building a business or renting one.
Rising sales with a falling TACoS means organic is growing faster than the spend: the advertising is doing its job and the listing is carrying more of its own weight. Rising sales with a rising TACoS means the growth is bought, and it stops when the spend does.
That distinction is invisible in ACoS, which is why an account can look healthy campaign by campaign while becoming more dependent on advertising every month.
Why a falling ACoS is sometimes bad news
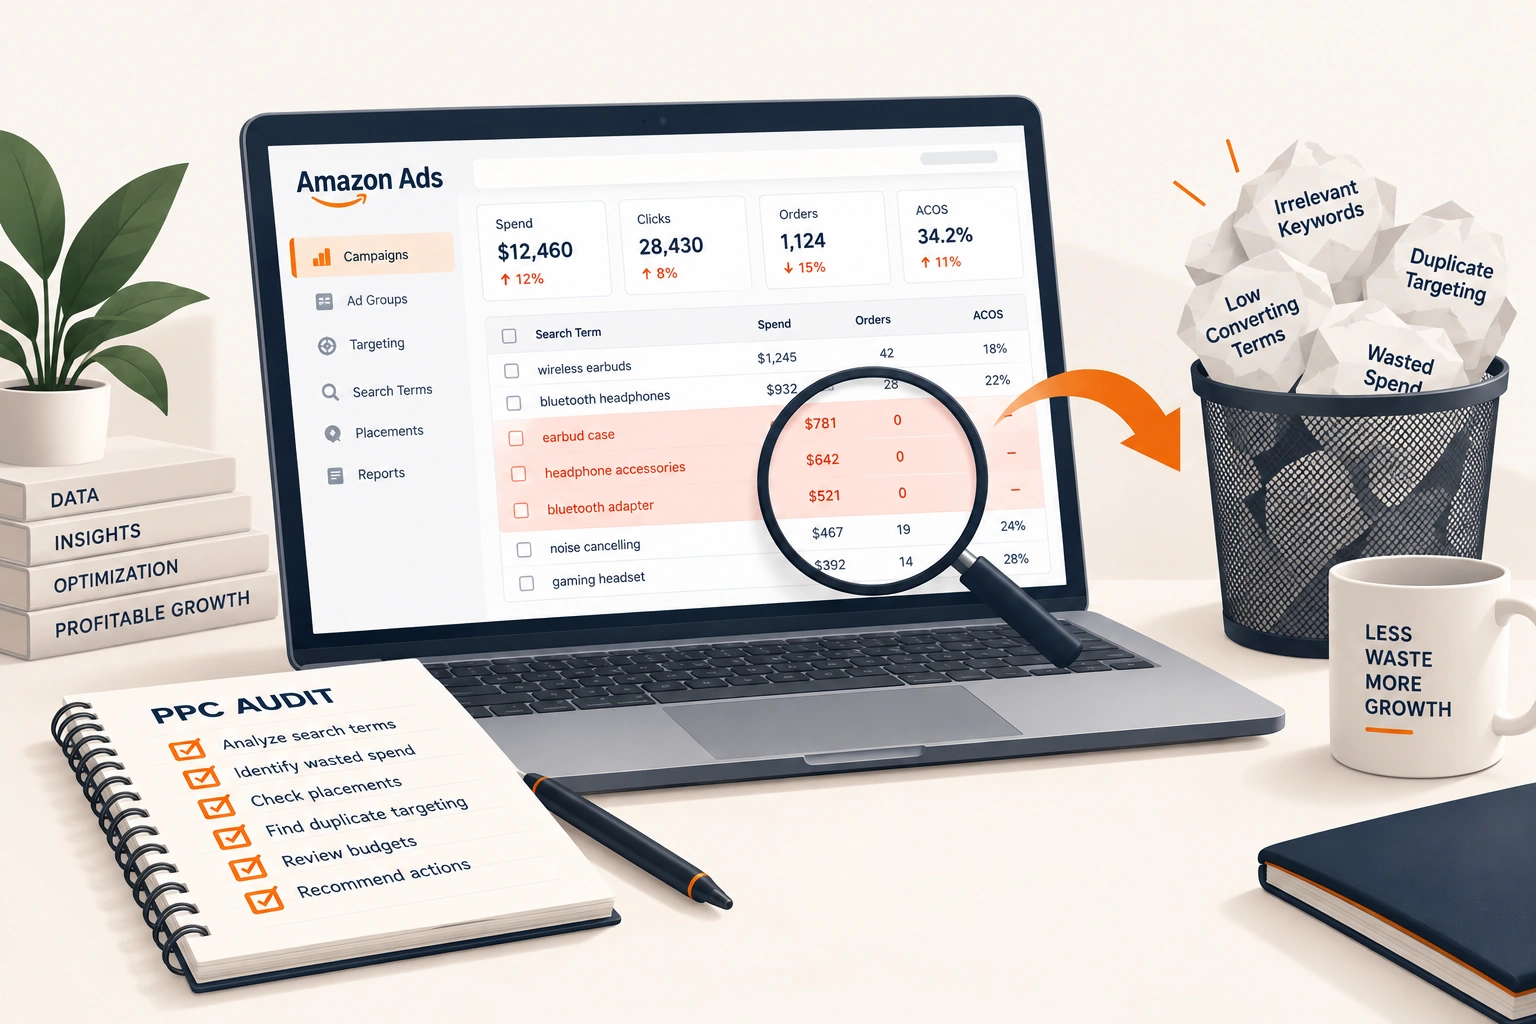
The fastest way to cut ACoS is to stop bidding on anything that does not convert immediately, which usually means brand terms and bottom of funnel keywords only.
Do that and the ratio improves while the top of the funnel disappears. Three months later the organic rank has slipped, the new customer count has fallen, and nobody can point at the change that caused it because the reporting looked better every week.
This is the single commonest way an account is optimised into decline, and it is the reason TACoS belongs on the same page as ACoS.
Which number for which decision
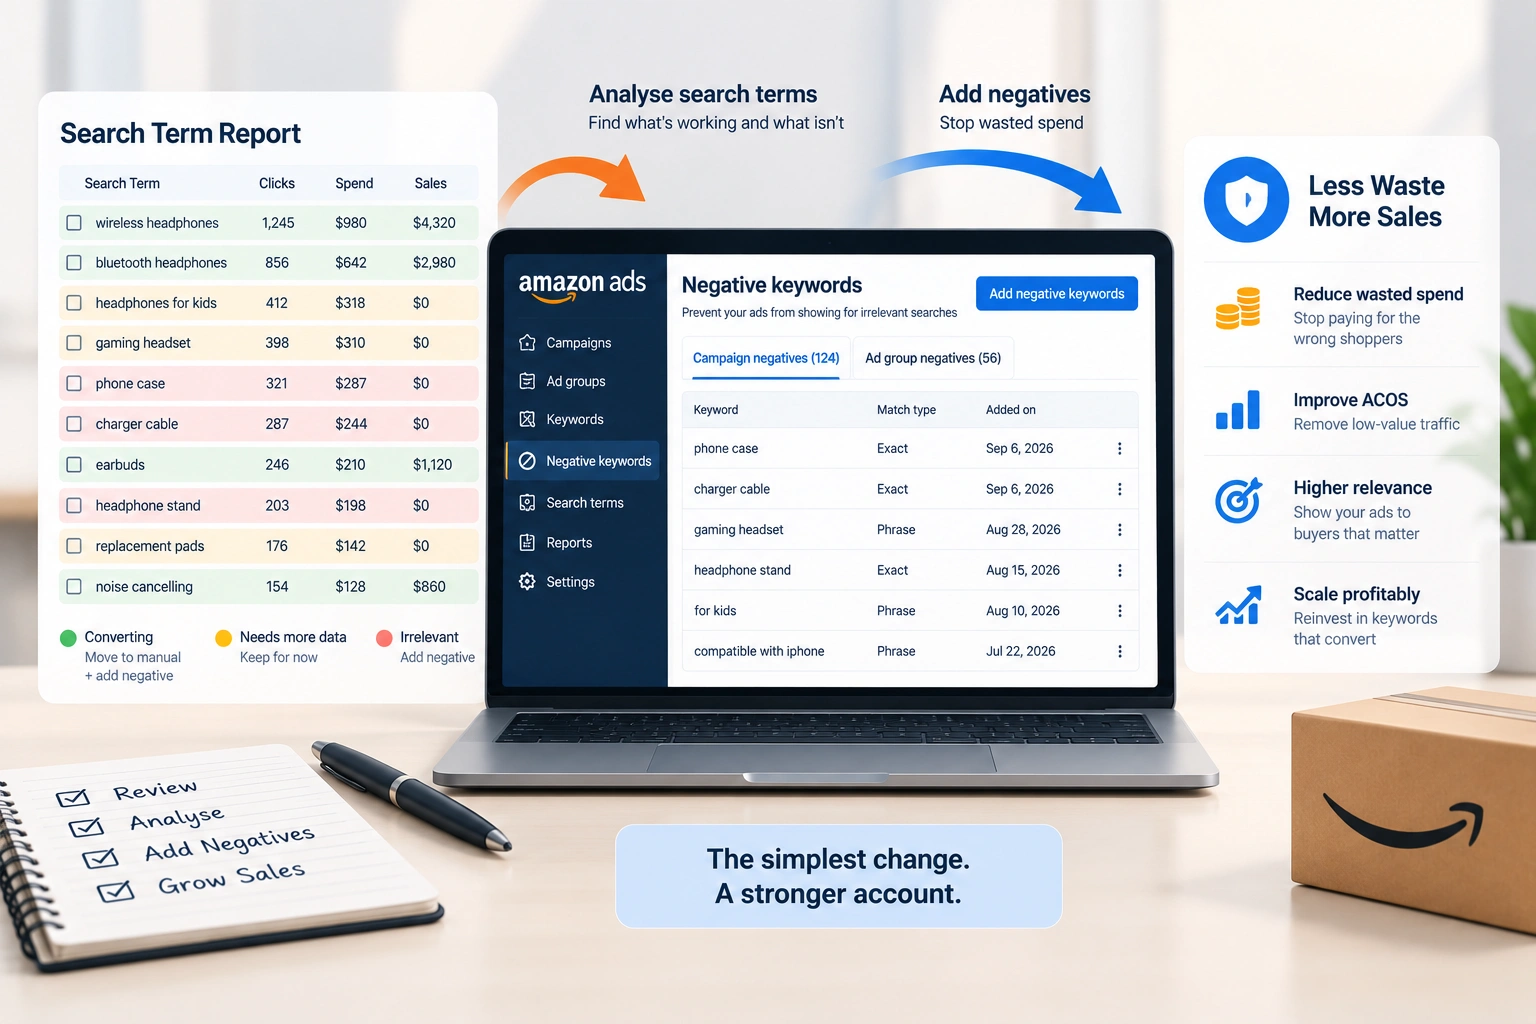
Bid and keyword decisions: ACoS, at the search term level, with enough clicks behind it to mean something.
Budget and channel decisions: TACoS, over a quarter, alongside total sales.
Talking to somebody from outside Amazon: ROAS, because it is the language they already have.
Deciding whether the business is profitable: none of the three. That is contribution margin after fees, storage, returns and the cost of goods, which is a different calculation entirely.
The break even, which is the only target that means anything
Break even ACoS is your contribution margin as a percentage of price. Above it you are buying revenue at a loss; below it you are making money on the marginal sale.
That number is specific to your product and nobody else's benchmark applies to it. A 15% ACoS is disastrous on a product with a 12% margin and generous on one with 60%.
Which is why a target handed over without seeing the margins is a guess, and why the first thing worth doing in any account is working out what break even actually is per product. Benchmarks by channel are in the ROAS standards article, with the same caveat.
What we do with this
Reporting starts from contribution margin and carries all three ratios as context, which is part of Amazon account management rather than a separate analytics exercise.
The same distinction exists on Walmart and in Google Ads, where the platform's own return figure is similarly happy to look excellent while the business does not grow.
If nobody has worked out your break even per product, that is the place to start.
Frequently asked questions
The questions that come up most often on this subject.
Below your break even, which is your contribution margin as a percentage of price. That number is specific to the product: 15% is disastrous on a 12% margin and generous on a 60% one. Any target quoted without seeing your margins is a guess at the most important input.
Total advertising cost of sale: ad spend divided by total sales, organic included. It is the only one of the three ratios that says whether advertising is building a business or renting one, because it is the only one that can see the organic sales the advertising caused.
They answer different questions. ACoS is the right number for a bid or keyword decision; TACoS is the right number for a budget or channel decision. An account judged only on ACoS can look healthy campaign by campaign while becoming more dependent on advertising every month.
With sales rising, it means organic is growing faster than the spend, which is advertising doing its job. With sales flat it means you are spending less and selling the same, which may be efficiency or may be a top of funnel you have quietly switched off.
Take the selling price, subtract the cost of goods, the referral fee, fulfilment, and the share of returns and storage the unit carries. What is left, as a percentage of the price, is break even ACoS. Above it the marginal sale loses money.
Because ACoS knows nothing about your costs. It compares spend against advertising revenue, not against margin, so a product with thin margins can post an excellent ratio and lose money on every unit. Profit is contribution margin after every cost, and that is a different calculation.
Not on the ratio alone. A campaign at a high ACoS that is lifting a listing's rank is buying something the ratio cannot see, and cutting it is the commonest way an account is optimised into decline. Look at what happened to total sales and to TACoS before deciding.
It is the same relationship the other way up: 25% ACoS is 4x ROAS. It exists in Amazon conversations because people arriving from Google and Meta think in ROAS. Pick one and be consistent, because using both is how two people disagree about an account they both understand.
There is no universal figure, and the direction matters more than the level. A mature catalogue with strong organic rank runs a lower TACoS than one launching products, and a rising TACoS during a launch is expected rather than alarming. What matters is whether it falls as the listings mature.
All three, with contribution margin above them. The ratios are context; the margin is the verdict. A report that leads with ACoS invites the decision that improves ACoS, which is not always the decision that grows the business.