Amazon Profit Analytics: What It Shows, What It Leaves Out, and the Unit Economics to Build Around It
Amazon's Profit Analytics puts 34 fee types and 10 cost types on one screen, per ASIN or SKU, with a price simulator. What it can tell you, where its numbers stop, and how to turn it into a per-unit contribution margin you can price and advertise against.


Loading Article banner
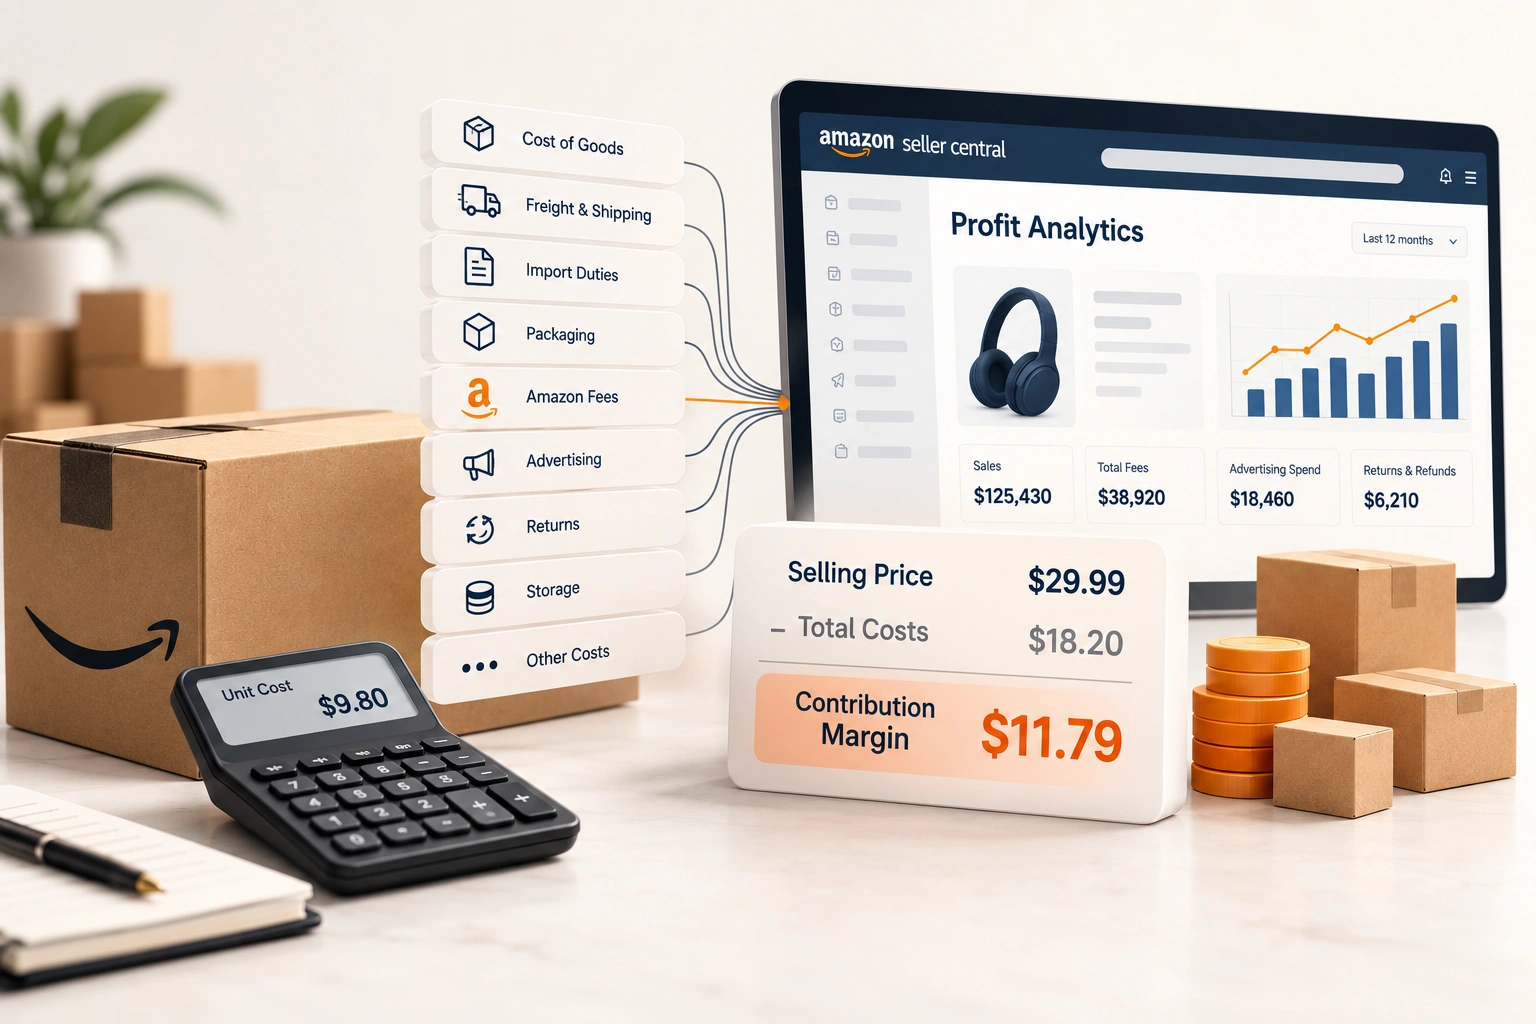
Most sellers know their sales to the dollar and their profit to the nearest guess. The fees are spread across a dozen reports, the costs of the goods live in a spreadsheet, and the two meet once a quarter, if at all. Amazon's Profit Analytics tool is the first serious attempt from Amazon itself to put the fee side of that in one place, per product.
It is worth using, and it is worth knowing exactly where its numbers stop. This is what Amazon says the tool does, what a per-unit margin needs that the tool cannot know, and how to build the rest.
What Amazon says the tool does
Amazon introduced it as "a powerful new tool to help you easily identify cost-saving opportunities and optimize your operations." Its scope: "This tool helps you analyze fees, costs, and profitability across your catalog, including sales, advertising spend, refunds, and returns. With this tool, you can analyze all of your costs from the past two years through the next 90 days, in one place."
The features, in Amazon's words: "Deep dive into ASIN- or SKU-level profitability. Simulate price changes. Factor in off-Amazon costs. Spot patterns and changes across 34 fee types and 10 cost types, so that you can better analyze any fluctuations over time. Model and compare the effect of potential changes to your pricing, services, or strategy, before you commit to any changes." It sits under Reports, in Selling Economics and Fees.
What it is good for
The fee side. Thirty four fee types is the honest count of what Amazon charges, and seeing them move over two years per SKU is something no seller could assemble by hand in an afternoon. A fee that changed is visible as a change, which is how the January 2026 adjustment shows up: Amazon put that year's FBA increase at "an average of $0.08 per unit sold," effective 15 January 2026, with "no new FBA fee types in 2026." Averages hide the products that moved more, and this is where to find them.
The 90 days ahead. Fee changes Amazon has announced but not yet applied appear in the forward view, which is the right place to test a price before the fee lands rather than after. And the simulator: a price change run through the tool shows what the fees do at the new price, since the referral fee is a percentage and the minimum still applies. Amazon's pricing page states the rule plainly: "For every item sold, you'll pay a percentage of the total price or a minimum amount, whichever is greater."
Where its numbers stop
Everything Amazon does not charge. The tool lets you "factor in off-Amazon costs," which means it will hold the numbers you give it and knows none of them by itself. The cost of the goods, the freight to the port and from it, the duty, the packaging, the prep and labelling, the inspection at the factory, the share of the payment terms: all of that is the seller's to enter, and the profit figure is only as true as those entries.
Returns are counted as Amazon sees them, as refunds and fees, not as what the returned unit is now worth, which may be nothing. Advertising is in, but as spend, and attributing it to a unit is a decision the seller makes, not a fact the tool holds. And the tool answers in Amazon's own categories: one seller's first question in the announcement thread was whether it would show a product reclassified into a higher referral fee band, which is the kind of change that appears as a fee moving rather than as a reason.
None of this is a fault. It is a fee tool doing the fee side well. The unit economics are the whole of it, and the whole is built outside the tool from what the tool provides.
The per-unit margin, built properly
Start from the selling price and take away, in order: the referral fee at its percentage or minimum; the fulfilment fee for the size tier; the storage cost per unit, which rises with the months a unit sits and in the fourth quarter; the advertising cost per unit sold, from actual spend divided by units, not from an ACoS target; the returns cost per unit, which is the refund rate times the lost value of a returned unit; and then the landed cost, which is the goods, the freight, the duty and the prep. Import duties are the line most often estimated and least often checked.
What is left is the contribution margin per unit, and it is the number every other decision hangs on: what price the product can hold, what a click is worth, how much storage a slow month can carry. Do it per channel, because the same unit sold on Walmart or the brand's own store meets a different fee stack and a different return rate. An example with round numbers, invented to show the shape: a $30 product with a 15% referral fee ($4.50), a $4.00 fulfilment fee, $0.40 of storage, $3.00 of advertising per unit sold, $0.90 of returns cost and a $9.00 landed cost leaves $8.20 a unit. Change the advertising to $5.00 and it leaves $6.20, which is the number that says whether the campaign was worth running.
Making the tool and the model agree
Keep one landed cost per SKU, dated, and enter the same figure in Profit Analytics and in the model, so the two never tell different stories. Reconcile monthly: the tool's fee totals against the settlement reports, the model's units against the orders. Where they disagree, the reason is usually a fee that changed or a cost that was updated in one place and not the other. Amazon's fees explained and what it costs to sell on Amazon cover the fee stack itself; FBA reimbursements covers the money that comes back and belongs in the same model.
Then use the margin, not the sales. A product with strong sales and a thin margin is a product the advertising is buying at a loss, and pricing for margin and rank is the decision that follows.
How we work on it
Our unit economics work builds the per-SKU, per-channel margin from the settlement data and the landed costs, reconciles it against Profit Analytics where the account has it, and hands back a model the business can run a price or an advertising budget through before committing. Selling plan and referral figures in this article are from Amazon's pricing page as read on 30 September 2026; Amazon changes fees on notice, and the model is only as current as its last reconciliation.
Frequently asked questions
The questions that come up most often on this subject.
A tool in Seller Central, under Reports and then Selling Economics and Fees, that analyses fees, costs and profitability across the catalogue, including sales, advertising spend, refunds and returns, from the past two years through the next 90 days, per ASIN or SKU, with a price simulator and a place to enter off-Amazon costs.
No. It lets you factor in off-Amazon costs, which means you enter the cost of goods, freight, duty, packaging and prep yourself. The profit it shows is only as accurate as those entries.
Selling price minus the referral fee, the fulfilment fee, storage per unit, advertising per unit sold, returns cost per unit, and the landed cost of the goods including freight, duty and prep. Do it per SKU and per channel.
Amazon said FBA fees would rise by an average of $0.08 per unit sold, effective 15 January 2026, with no new FBA fee types in 2026. Averages hide the products that moved more, which Profit Analytics can show per SKU.
As a percentage of the total price or a minimum amount, whichever is greater, with the percentage set by category. Amazon's pricing page carries the current rates; the Professional plan is $39.99 a month and the Individual plan $0.99 per item sold.