Incrementality Testing Across Meta, Google and Amazon: How to Find Out Which Sales Your Ads Actually Caused
Every ad platform credits itself with the sale. On 19 October 2026 Meta published four agencies' lift tests, Google has cut the cost of a Conversion Lift study to a $5,000 floor, and Amazon reports on last touch. What each platform offers, what the results showed, and how to read three tests as one budget.


Loading Article banner
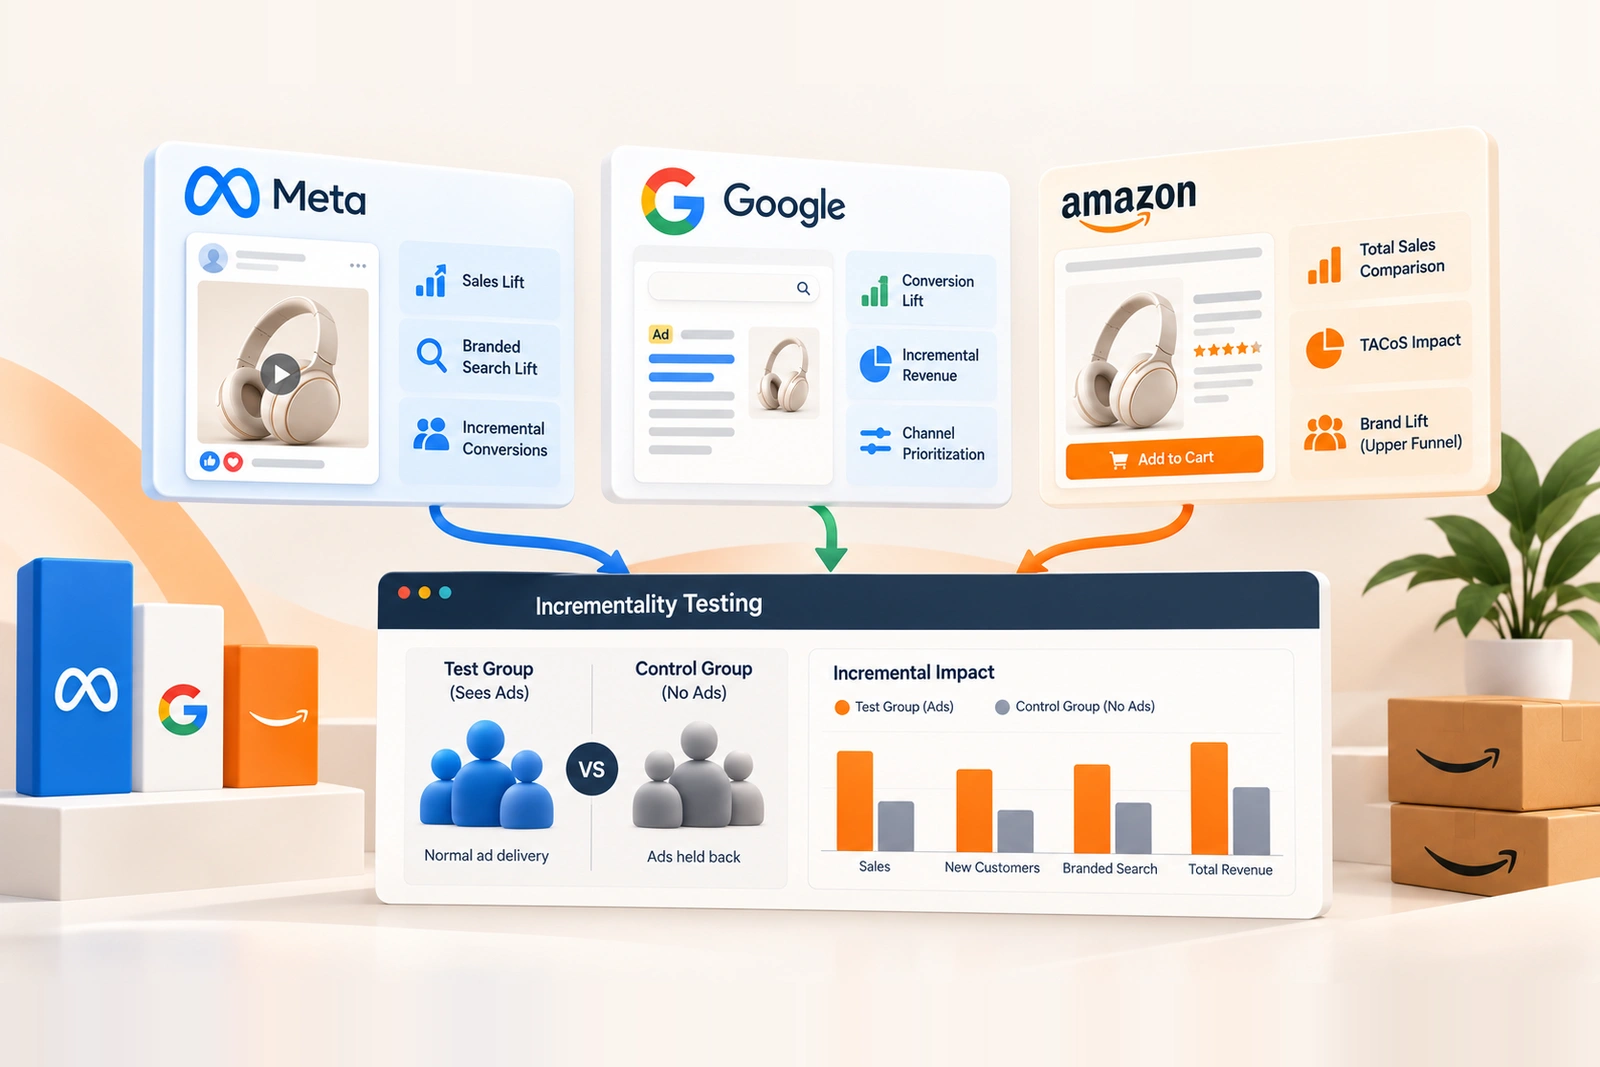
A brand advertising on Meta, Google and Amazon gets three dashboards, and each one credits itself with the sale. The shopper who saw a Reel, searched the brand on Google and bought on Amazon is a conversion in all three, and adding the three together counts one sale three times. The question that settles a budget is a different one: which of those sales would not have happened without the ads.
That is what an incrementality test answers, and on 19 October 2026 Meta published four agencies' tests to show how. This article sets out what each of the three platforms offers in its own words, what Meta's examples found, and how to read three tests as one plan.
What a lift test is
Meta's description is the clearest: "You hold your ads back from a randomly chosen group, run everything as normal for everyone else", then "compare what the two groups did." The difference is the lift: the sales, sign-ups or searches the ads caused, as opposed to the ones they were present for.
Two variants matter for a product brand. A user-level test, where the platform withholds ads from a random set of people, and a geographic or time-based holdout, where the brand switches advertising off in comparable regions or periods and compares totals. The first is precise but sees only that platform's own outcomes; the second is coarser but sees everything, including sales on other channels.
Meta: what four agencies' tests found
Meta's post names the methods its partners used, its conversion lift test and its search lift methodology, and the results it reports are worth reading for their shape more than their size. One retailer's new campaign setup, tested against the old, drove 23% more total purchases and a 15% better return on ad spend. In another test, branded searches among people who saw Meta ads were "up 2.2X" and unpaid search traffic rose 24%. A third measured 14% more paid search traffic.
These are Meta's own published case studies, not independent results, but two of the four found the same thing: Meta advertising showed up as search. That is the effect a Google dashboard credits to Google. Meta's own advice is the useful part: "Each agency picked one question it actually wanted answered", and "None of this required extra budget or new technology."
Google: Conversion Lift at a lower floor
Google cut the price of the question in 2025. Its announcement of 11 November 2025 reads: "What once might have cost upwards of $100,000 for a single experiment can now be done for $5,000." Conversion Lift studies moved to a Bayesian method during 2025, using results from earlier studies as a starting point, which Google says supports smaller budgets, and reporting results as a probability: "There is a 90% probability that the campaign had increased your conversions."
The floor is real, not nominal. Google's help page says results may not appear when spend is below $5,000, and sets a conversion threshold of "150 conversion coming from the treatment group, and 65 from the control group"; directional results, below 90% certainty, need budgets above $5,000 and 1,000 conversions. A brand with few conversions a month should plan a longer test or a geographic holdout instead.
Google has also given advertisers a place to act on a result. Its channel prioritisation, announced on 14 October 2026 and rolling out to Search, Shopping, Performance Max and Demand Gen over the next months, lets an advertiser mark channels as low priority and cap them at a maximum percentage of the daily budget. A lift test is how that percentage gets set by evidence rather than habit. Meta ads against Google ads for eCommerce sets out what each tends to be good at.
Amazon: last touch, and the test a brand designs
Amazon's own description of its standard campaign reporting is last-touch attribution, and Amazon Marketing Cloud lets registered users customise the attribution they analyse. For awareness, Amazon Brand Lift measures "upper and mid-funnel Amazon Ads campaigns" through the Amazon Shopper Panel, for self-service and managed advertisers in the US, Canada and the UK. We found no Amazon page describing a native conversion lift test for sponsored ads.
So on Amazon the incrementality test is one the brand designs: advertising paused for a set of comparable products or a set period, and total sales, not attributed sales, compared. Total advertising cost of sale is the measure that sees it, which is why ACoS, TACoS and ROAS answer different questions. A regional holdout of the kind described in podcast ads on Amazon DSP works for upper-funnel spend.
Reading three tests as one plan
One question per test. Start with the platform taking the largest share of the budget, or the one whose dashboard is least believed. A test that tries to answer everything answers nothing.
Measure in totals. Total revenue, new customers and branded search across every channel, not each platform's attributed conversions. Meta's examples are the reason: an ad on one platform can appear as a sale credited to another.
Move the budget, then test again. A result is true for the season it was measured in. The fourth quarter behaves differently, which Q4 advertising budgets across the marketplaces covers, and AI-run campaigns such as Amazon's Full-Funnel Campaigns change what is being tested each time the platform changes how it spends.
Never sum the dashboards. Three platforms reporting the same sale is the problem the test exists to solve.
Where we fit
Incrementality is the part of an advertising plan no single platform will do for you, because each platform's measurement ends at its own walls. Designing the tests, reading them against total sales and moving the budget across Amazon, Google and Meta on what they show is the centre of our growth and advertising work. If you would like to know which of your channels is doing the work its dashboard claims, one well-chosen test is where we would start.
Frequently asked questions
The questions that come up most often on this subject.
A test that measures the sales an ad caused rather than the sales it was present for. Ads are withheld from a randomly chosen group, or switched off in comparable regions or periods, and the results are compared with the group that saw them. The difference is the lift, which is the number a budget should be set on.
Google said in November 2025 that an experiment that once cost upwards of $100,000 can now be done for $5,000. Its help page adds conversion thresholds: results may not appear below $5,000 of spend, or below 150 conversions from the treatment group and 65 from the control group; directional results, below 90% certainty, need budgets above $5,000 and 1,000 conversions.
For awareness, yes: Amazon Brand Lift measures upper and mid-funnel campaigns through the Amazon Shopper Panel in the US, Canada and the UK. For sales from sponsored ads we found no native lift test, so the brand designs its own: pause advertising on comparable products or for a set period and compare total sales, not attributed sales.
Each platform attributes conversions to its own ads using its own rules, and none sees the others' touchpoints. A shopper who saw a Meta ad, searched on Google and bought on Amazon can be counted by all three. That is why the platforms' reported conversions should never be added together, and why a lift test measured in total sales is the tiebreaker.
In Meta's own published case studies of October 2026, two of four agency tests found that people who saw Meta ads searched more: branded searches up 2.2 times and unpaid search traffic up 24% in one, paid search traffic up 14% in another. These are Meta's results, not independent ones, but they are why a Meta test should be read in branded search as well as in Meta's dashboard.