
Beauty & Personal Care
+$4.2MRevenue, +316K Units
Traffic was climbing faster than the revenue it was producing.
Read the case studyGoogle Ads spent every day of January, but sold on almost none of the first 18.
Home & Kitchenware · Jan to Feb 2026 · Published September 2026
Services behind this work
Loading Home & Kitchenware banner

Revenue
$310K
from $217K
+42.86%
Ad Spend
$6.5K
from $6.38K
+1.88%
Cost per Conversion
$80.94
from $126
-35.76%
Actual RoAS
4,772.65%
from 3,400.60%
+40.35%
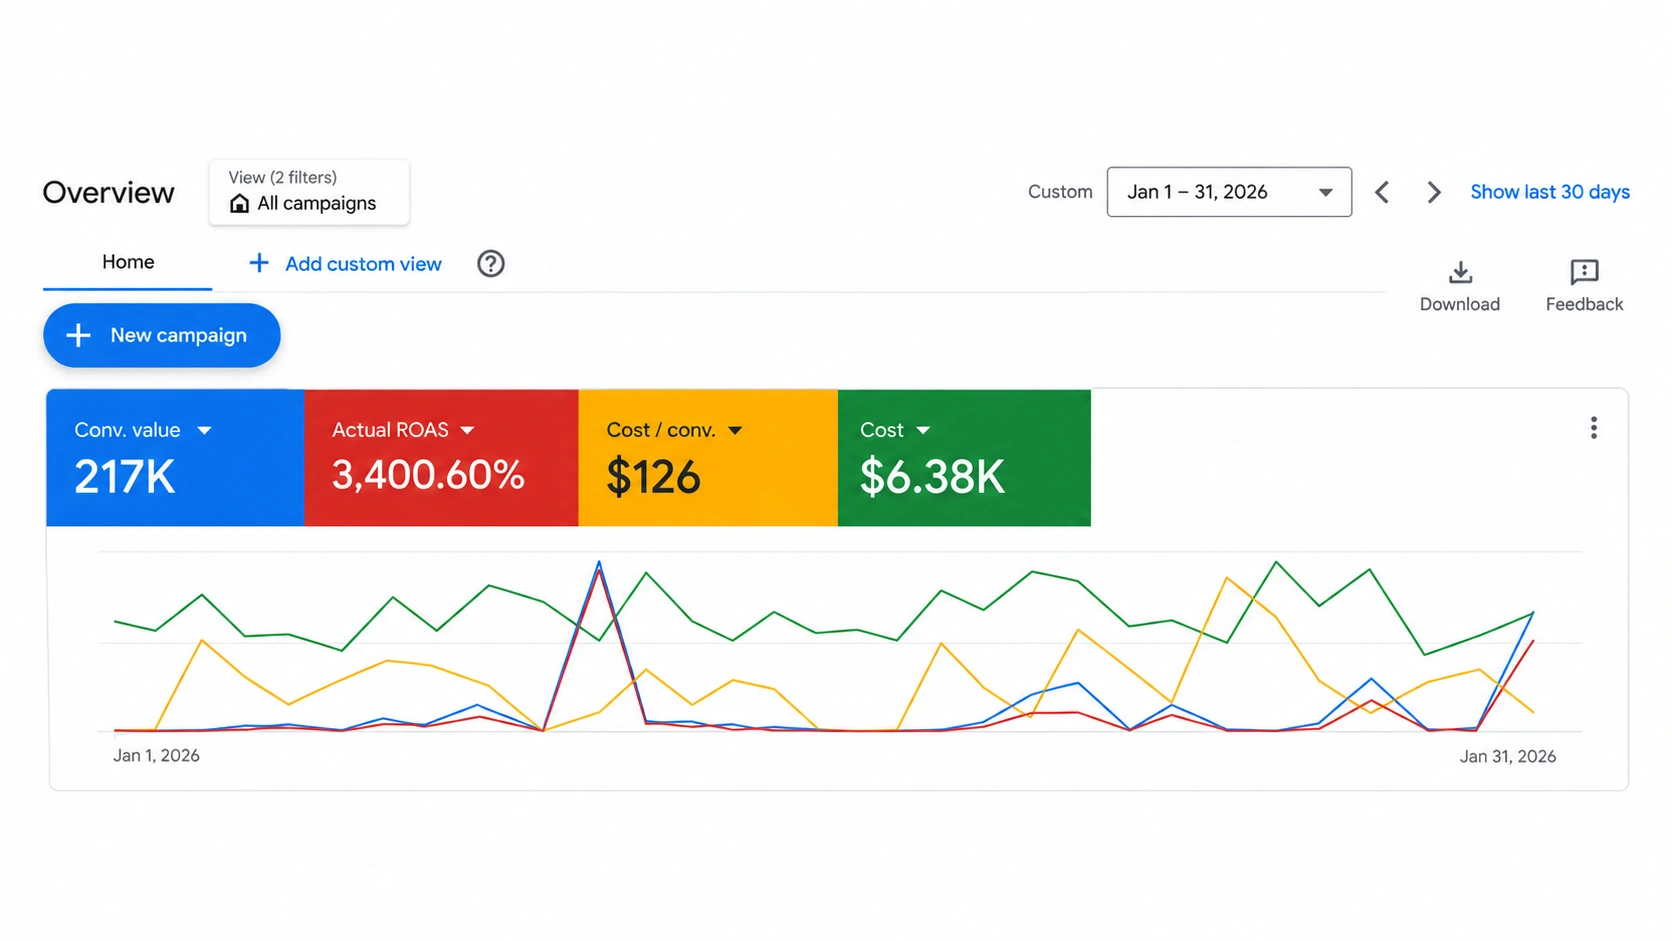
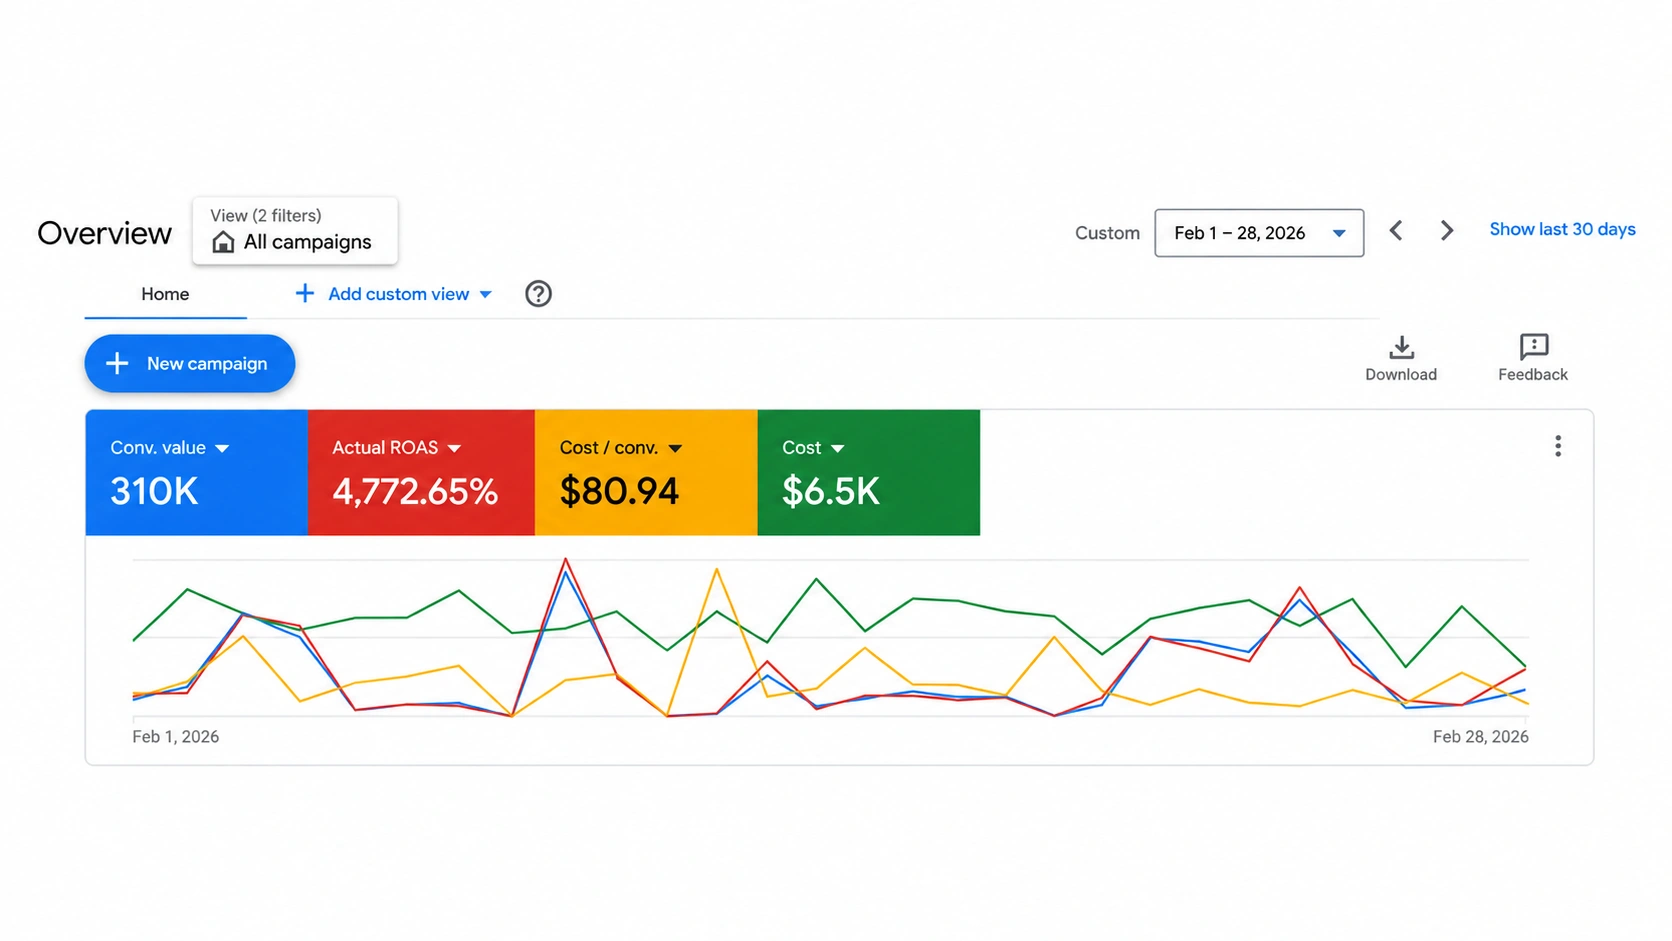
Google Ads platform figures for Jan 1 to 31, 2026 against Feb 1 to 28, 2026, from the same account view, covering conversion value, ROAS, cost per conversion and spend, including branded search. February has three fewer days. The work covered Jan to Feb 2026.
For the first 18 days of January 2026, Google Ads spent daily while conversion value stayed near zero, apart from one spike around January 11. More than half the $6.38K budget was gone before revenue picked up. The month closed at $217K from roughly 51 conversions. Budget was not the constraint; targeting was. Branded and generic search shared campaigns, so cheap brand conversions hid weak generic returns, and Smart Bidding could not distinguish a returning buyer from a first-time browser.
Beauty & Personal Care
Traffic was climbing faster than the revenue it was producing.
Read the case study
Beauty & Personal Care
Revenue was growing while the catalogue underneath worked against the brand.
Read the case study
Beauty & Personal Care
Six months of flat volume at an average order of $25.49.
Read the case study
Home & Kitchenware
Google Ads scaling drove 236.13% sales growth and 211.36% more conversions.
Read the case study
Food & Beverage
Three campaigns, seventy orders a month, and bidding aimed at the wrong goal.
Read the case study
Baby & Kids
The whole catalogue competed for a budget of a few hundred pounds.
Read the case study
Health & Wellness
Two weeks of January carried the year, then the line fell away.
Read the case study
Health & Wellness
A high value catalogue grew on both order count and what each order was worth
Read the case study
Tools & Home Improvement
A twelve thousand order account grew without discounting its way there.
Read the case study
Baby & Kids
A premium range stopped being judged on its cheapest option.
Read the case study
Baby & Kids
January closed at 844 orders and $28,350.95 ($28.4K), and the account read as a
Read the case study
Sports & Outdoor
More frequent purchases from a catalogue built for one and done buying.
Read the case study
Office Products
At $19.17 an order there is no margin for an inefficient click, and February's
Read the case study
Food & Beverage
A mature account improved on the measure its monthly totals were hiding.
Read the case study
Clothing & Accessories
A range still finding its feet reached scale without cutting its price.
Read the case study
Baby & Kids
A stock up buying habit was already there and the range could not serve it.
Read the case study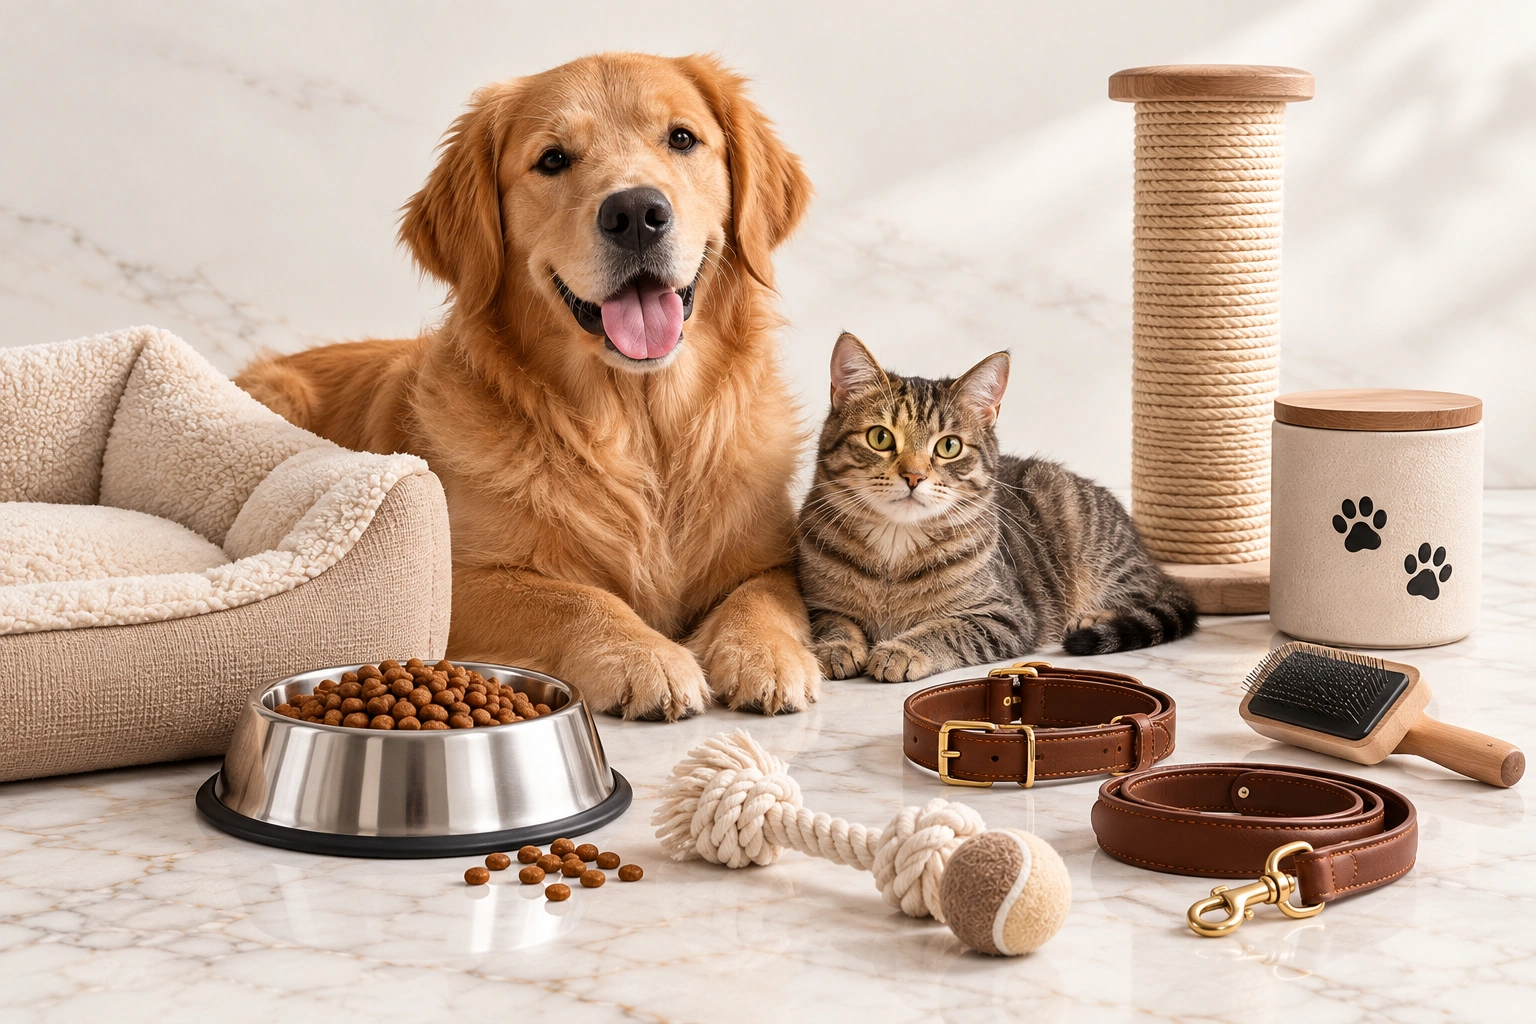
Pet Supplies
A price held too long was tested, moved, and paid for itself in volume.
Read the case study
Health & Wellness
Three fewer trading days hid a month that was better than its total.
Read the case study
Food & Beverage
January is supposed to be the quiet month. This account grew through it.
Read the case study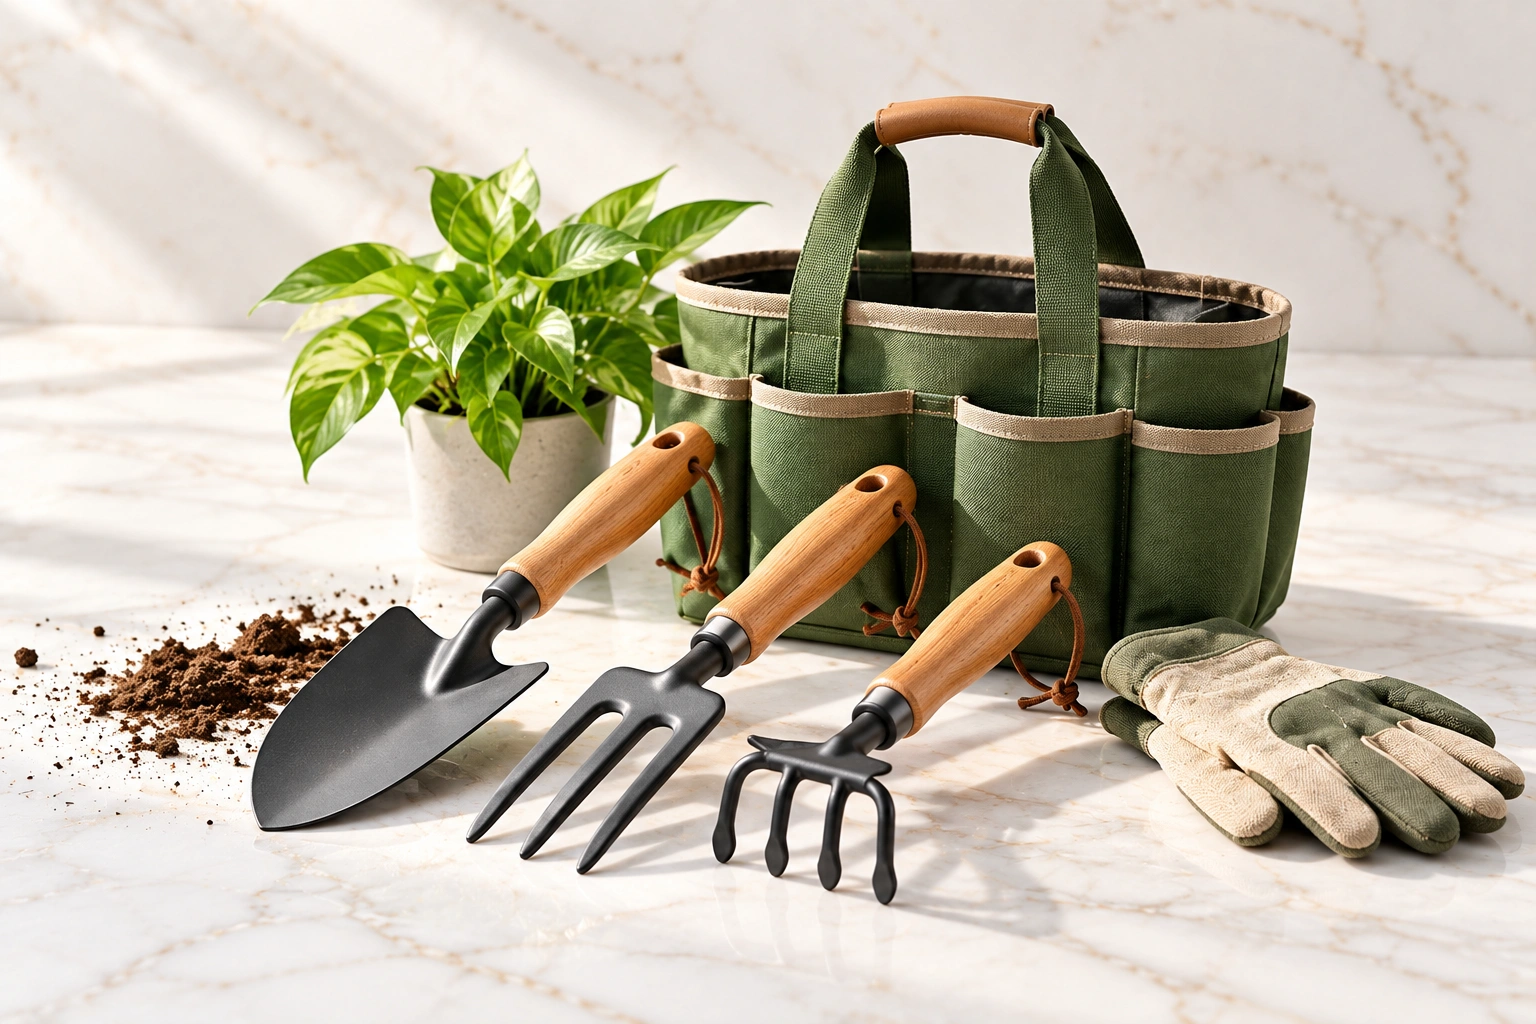
Patio, Garden & Tools
A catalogue that had stopped trading was restored to service.
Read the case study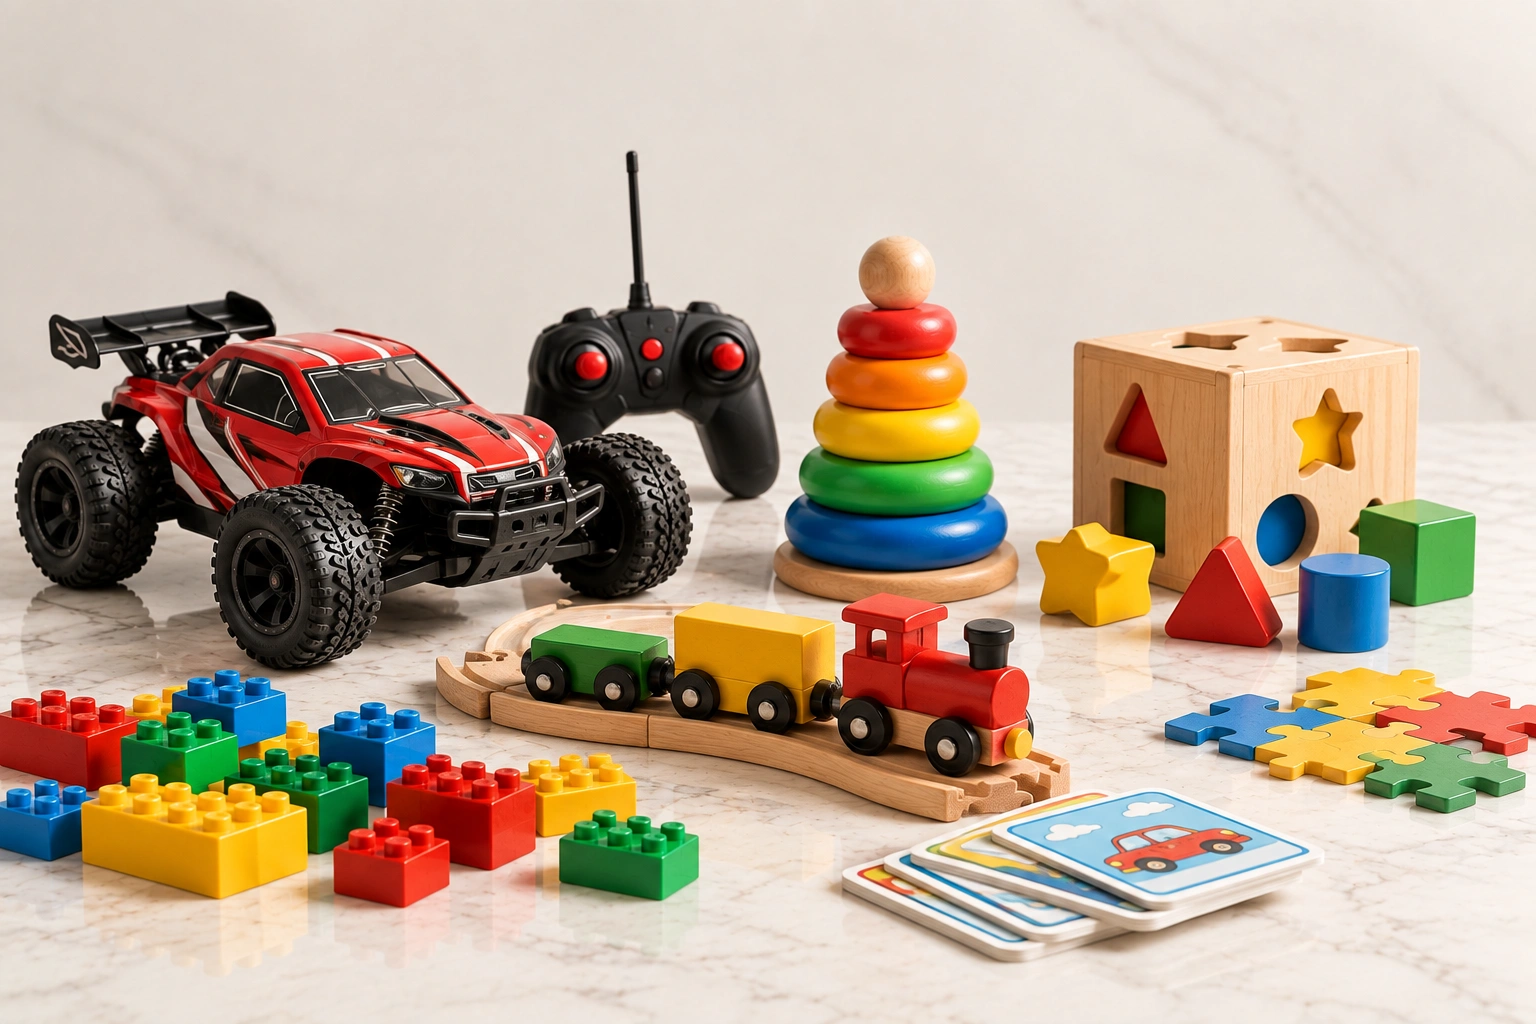
Toys & Games
A catalogue sold one item at a time started selling two.
Read the case study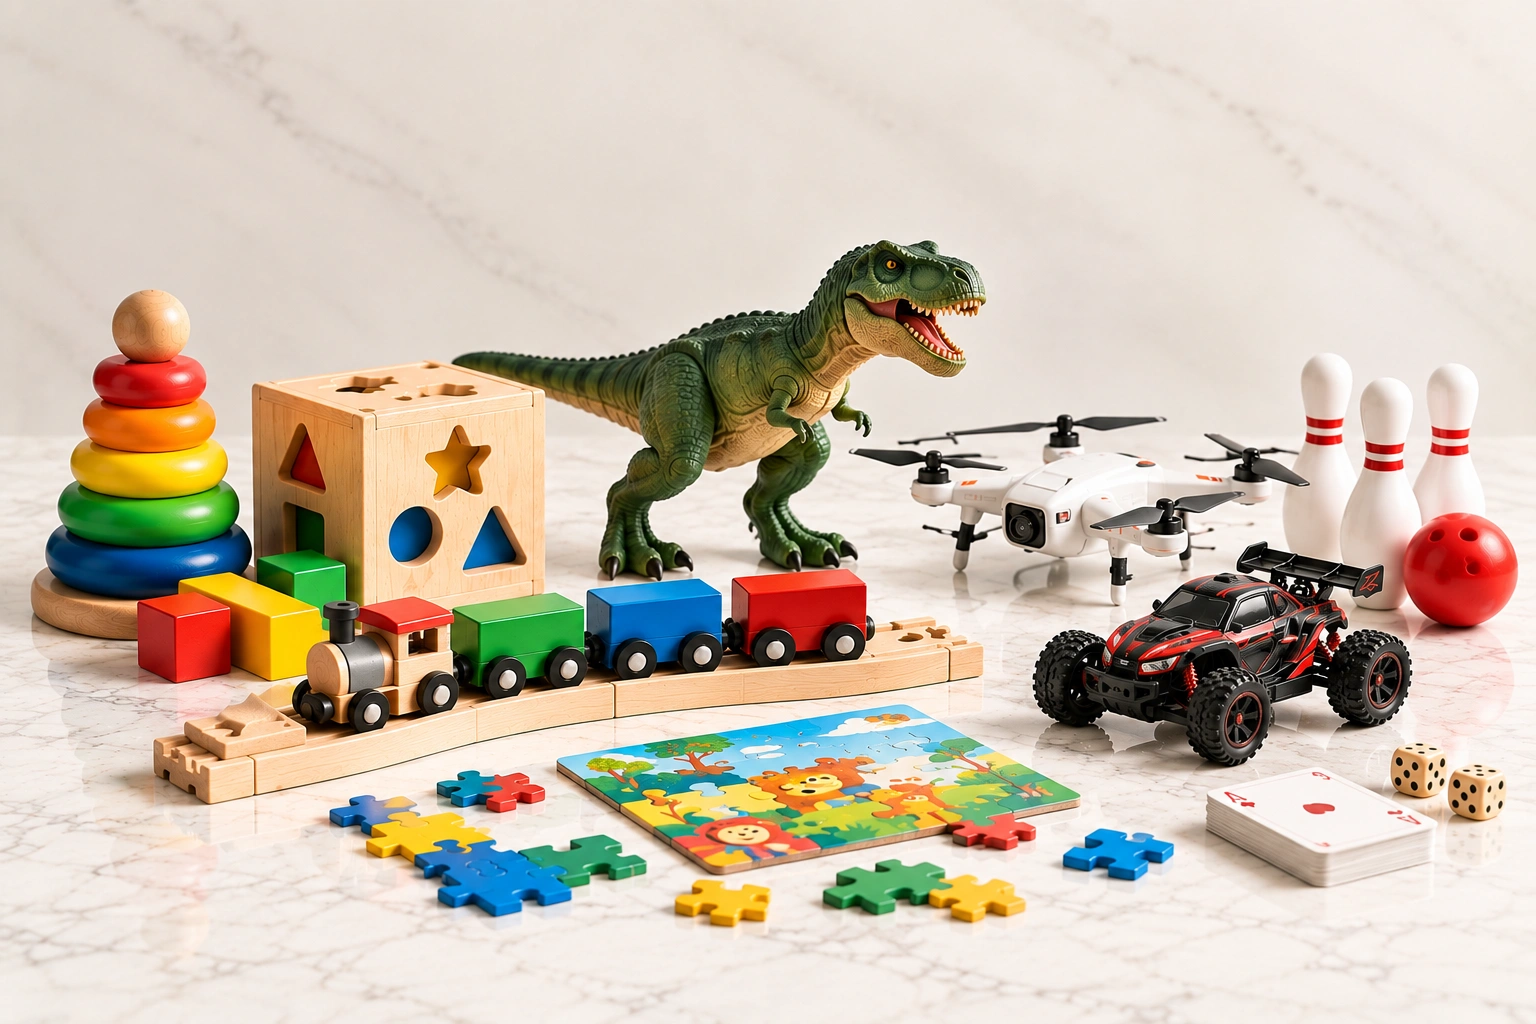
Toys & Games
A range stopped meeting new buyers at its cheapest price.
Read the case study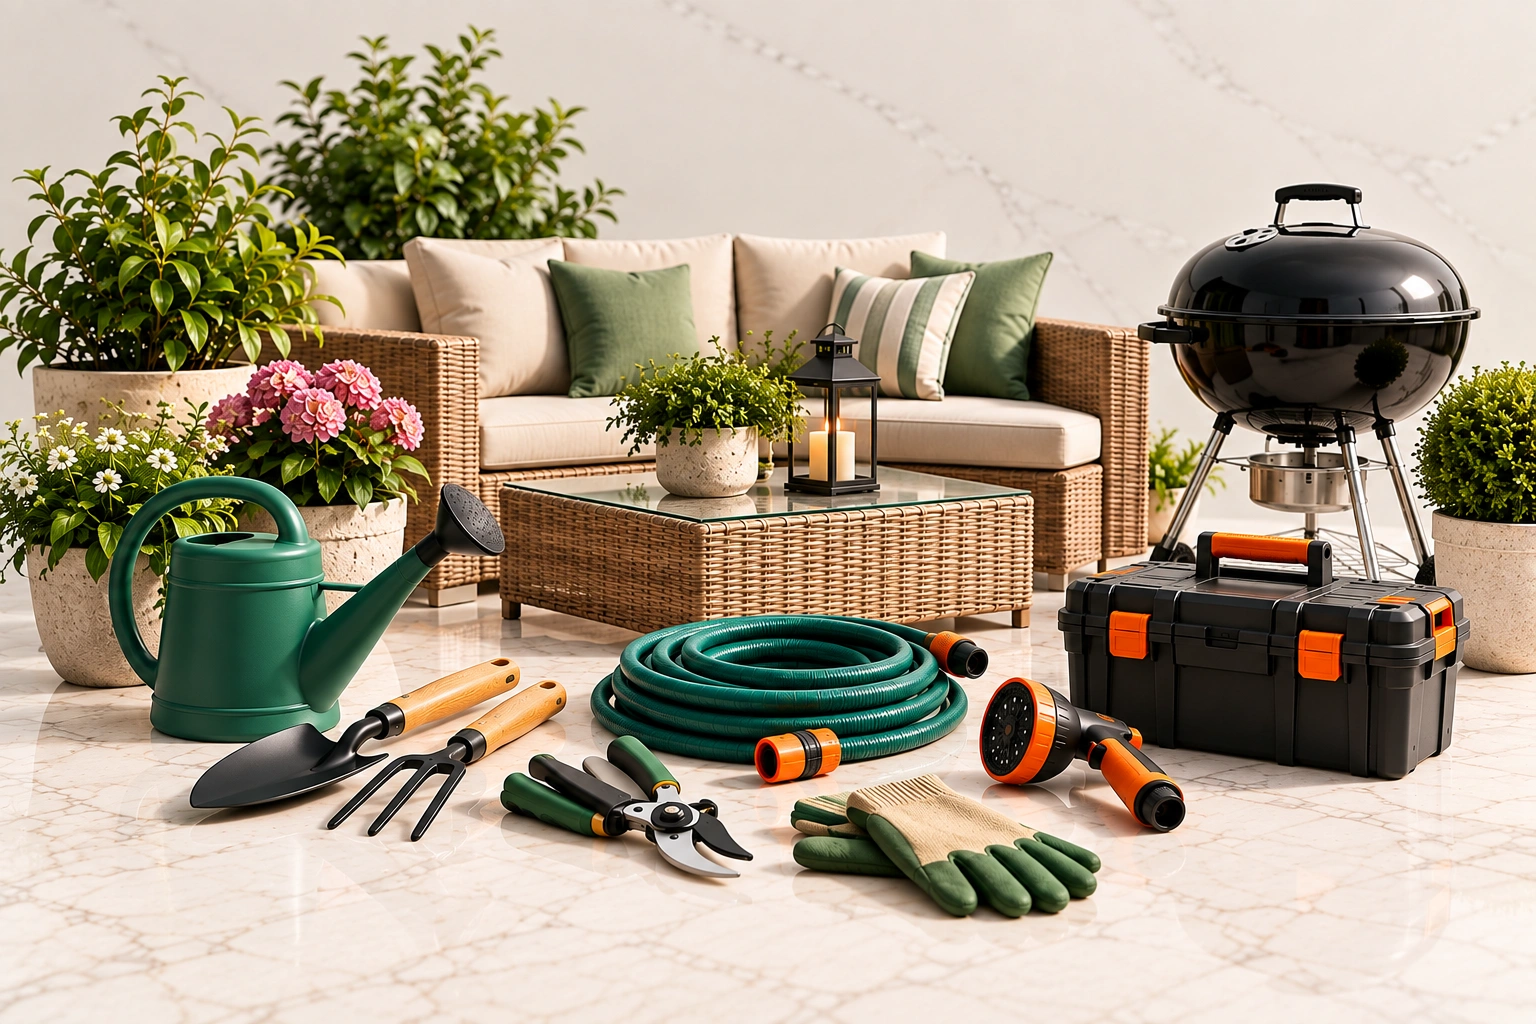
Patio, Garden & Tools
The month after a record is usually where large accounts give it back.
Read the case study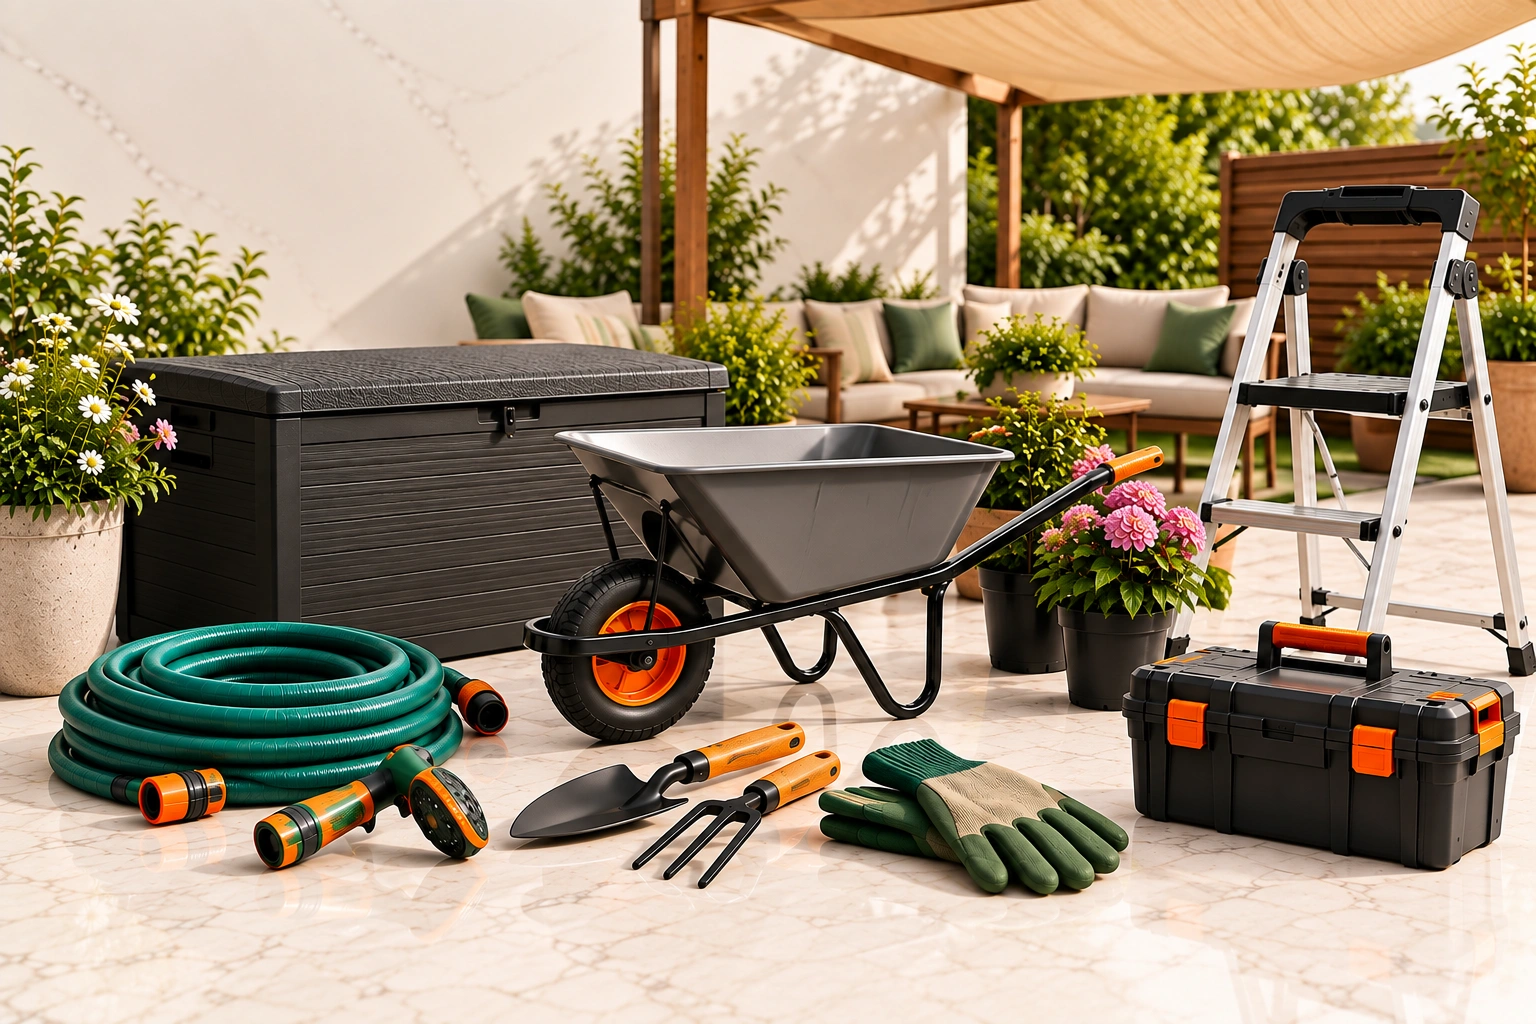
Sports & Outdoor
A small account grew on volume and order value at the same time.
Read the case study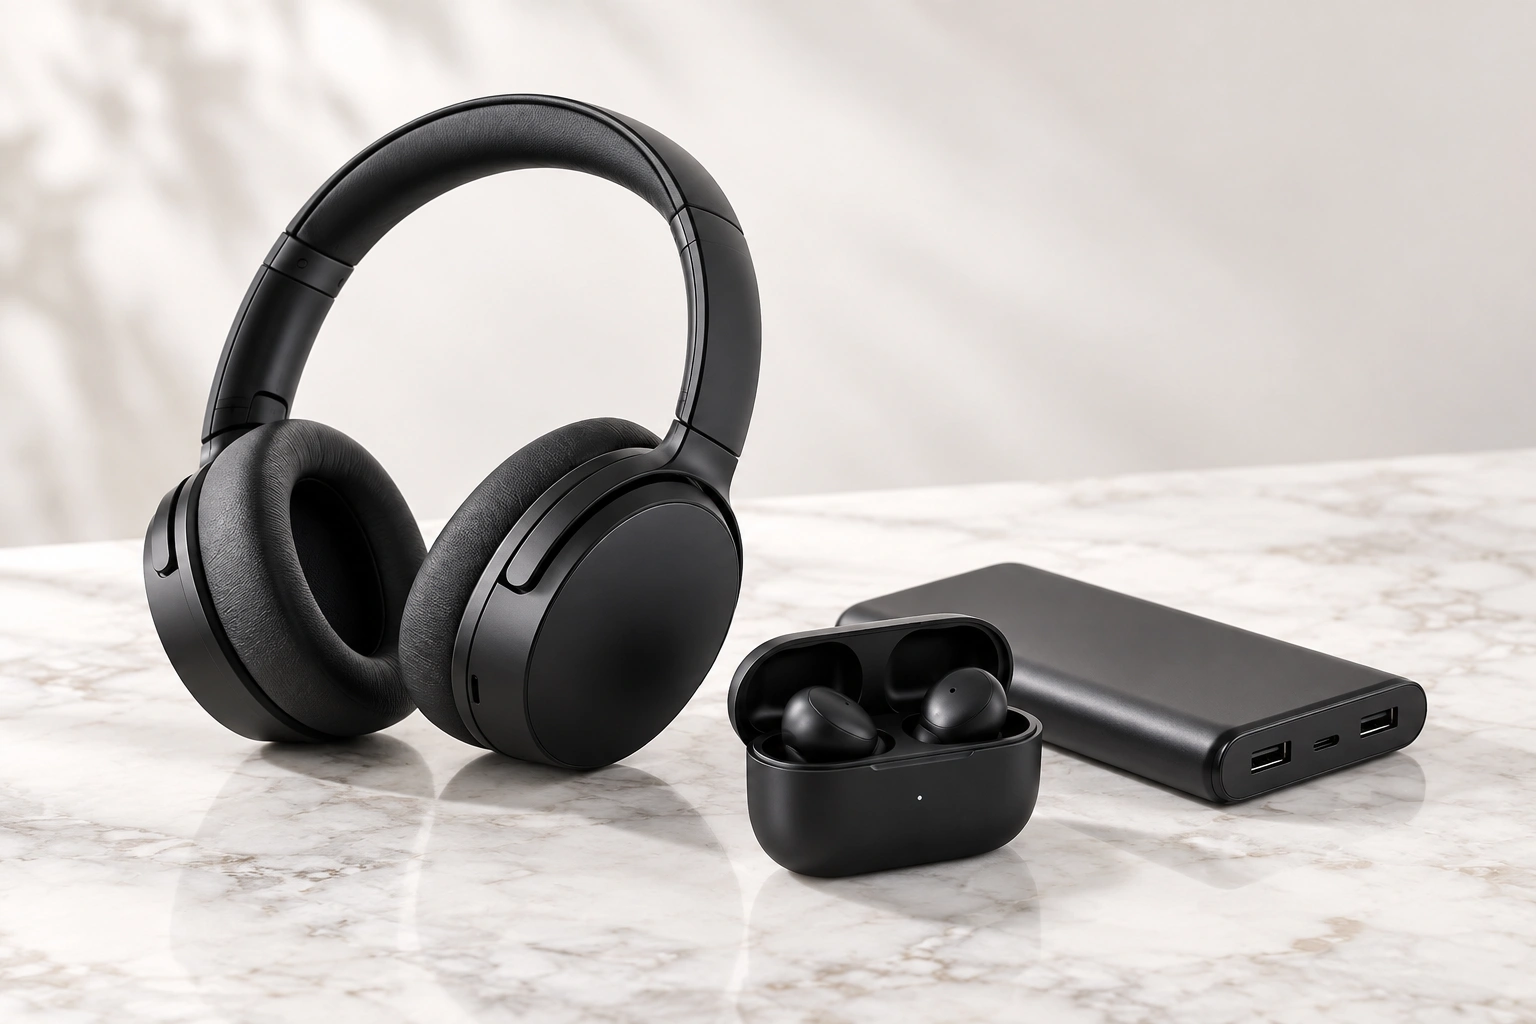
Electronics
A large account found volume in the places too small to bother with alone.
Read the case study
Clothing & Accessories
A wider range moved more units than the lower average order cost it.
Read the case study
Health & Wellness
An account that was really one product started selling like a catalogue.
Read the case study
Tools & Home Improvement
A brand converted more of the visitors it was already paying to attract.
Read the case studyTell us where you are now and we will tell you what we would change first, before you commit to anything.