

Beauty & Personal Care
+9.74%Revenue Growth
Revenue was growing while the catalogue underneath worked against the brand.
Read the case studyTraffic was climbing faster than the revenue it was producing.
Beauty & Personal Care · 2024 to 2025 · Published September 2026
Loading Beauty & Personal Care banner

Shipped Revenue
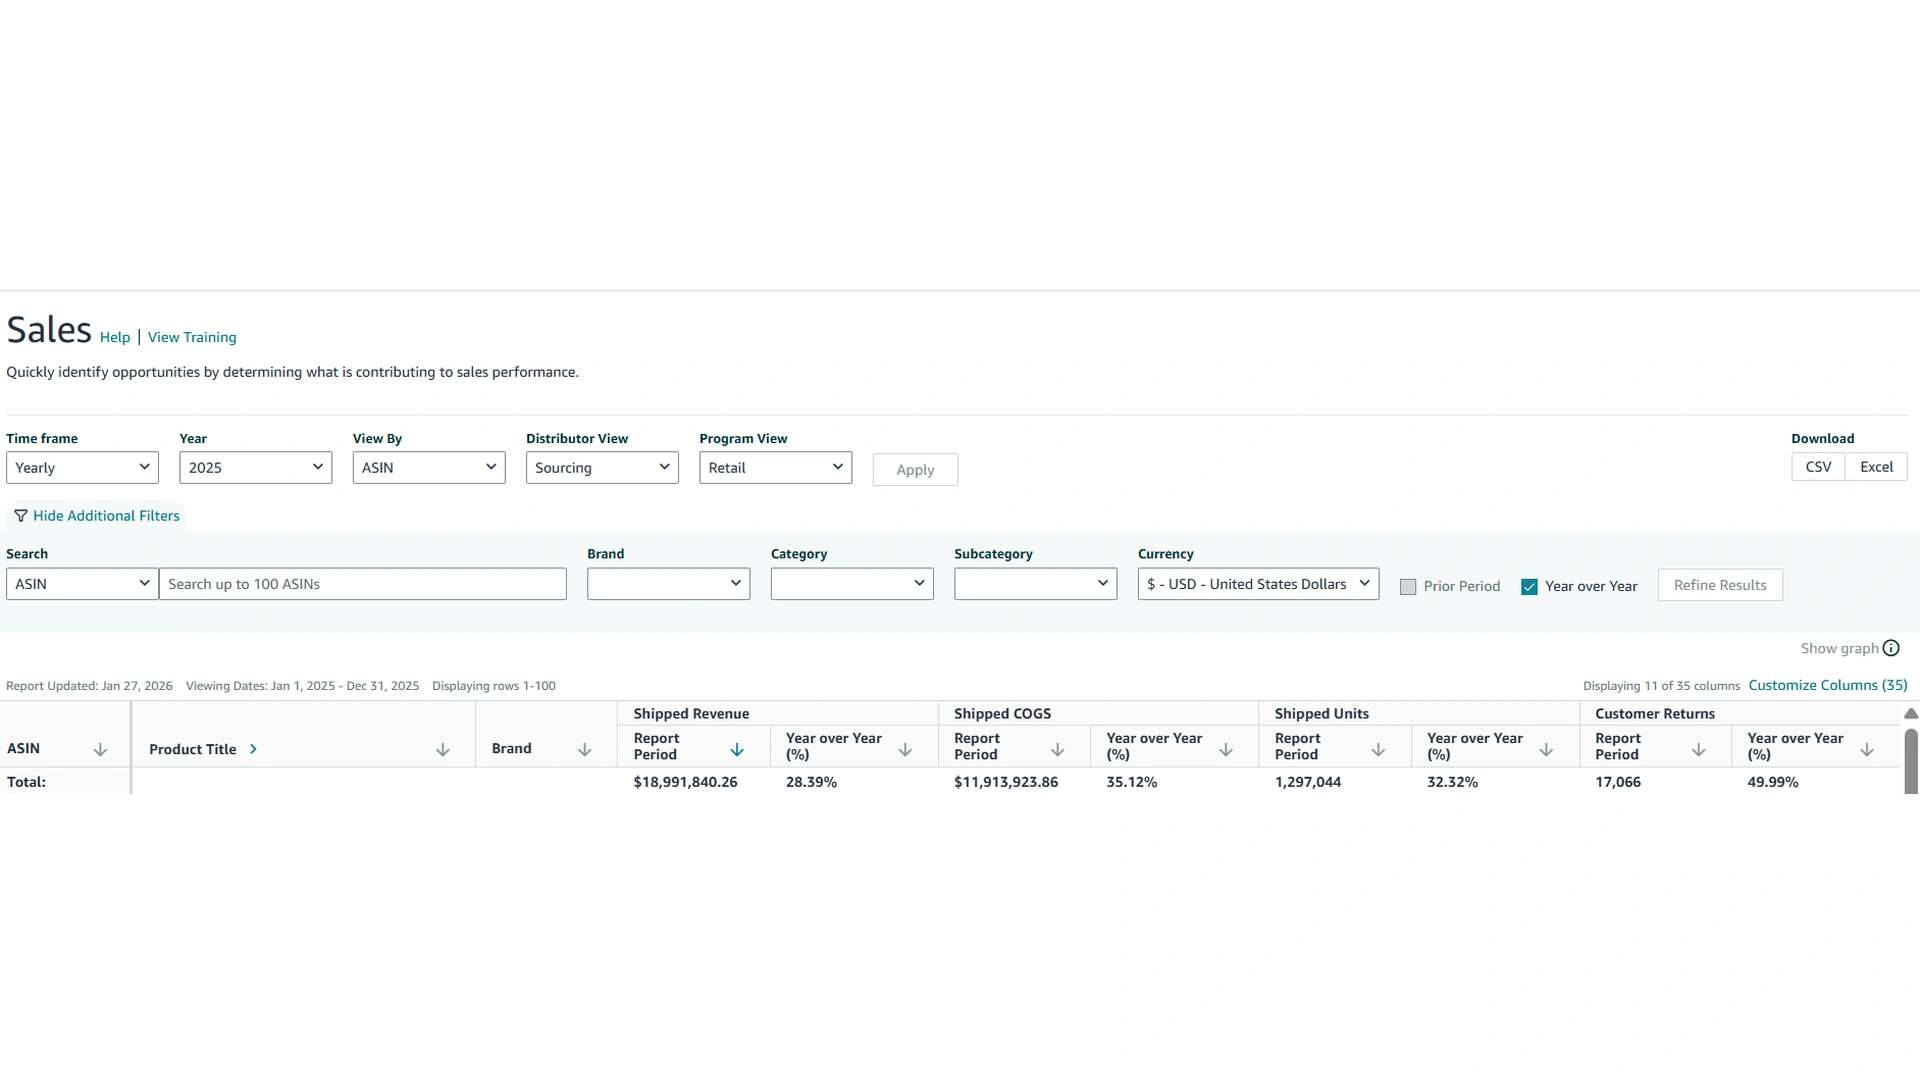
$18.99M
from $14.8M
+28.31%
Shipped Units
1.29M
from 980.21K
+31.60%
Shipped COGS
$11.91M
from $8.8M
+35.34%
Returns
17,066
from 11,377
+50.00%
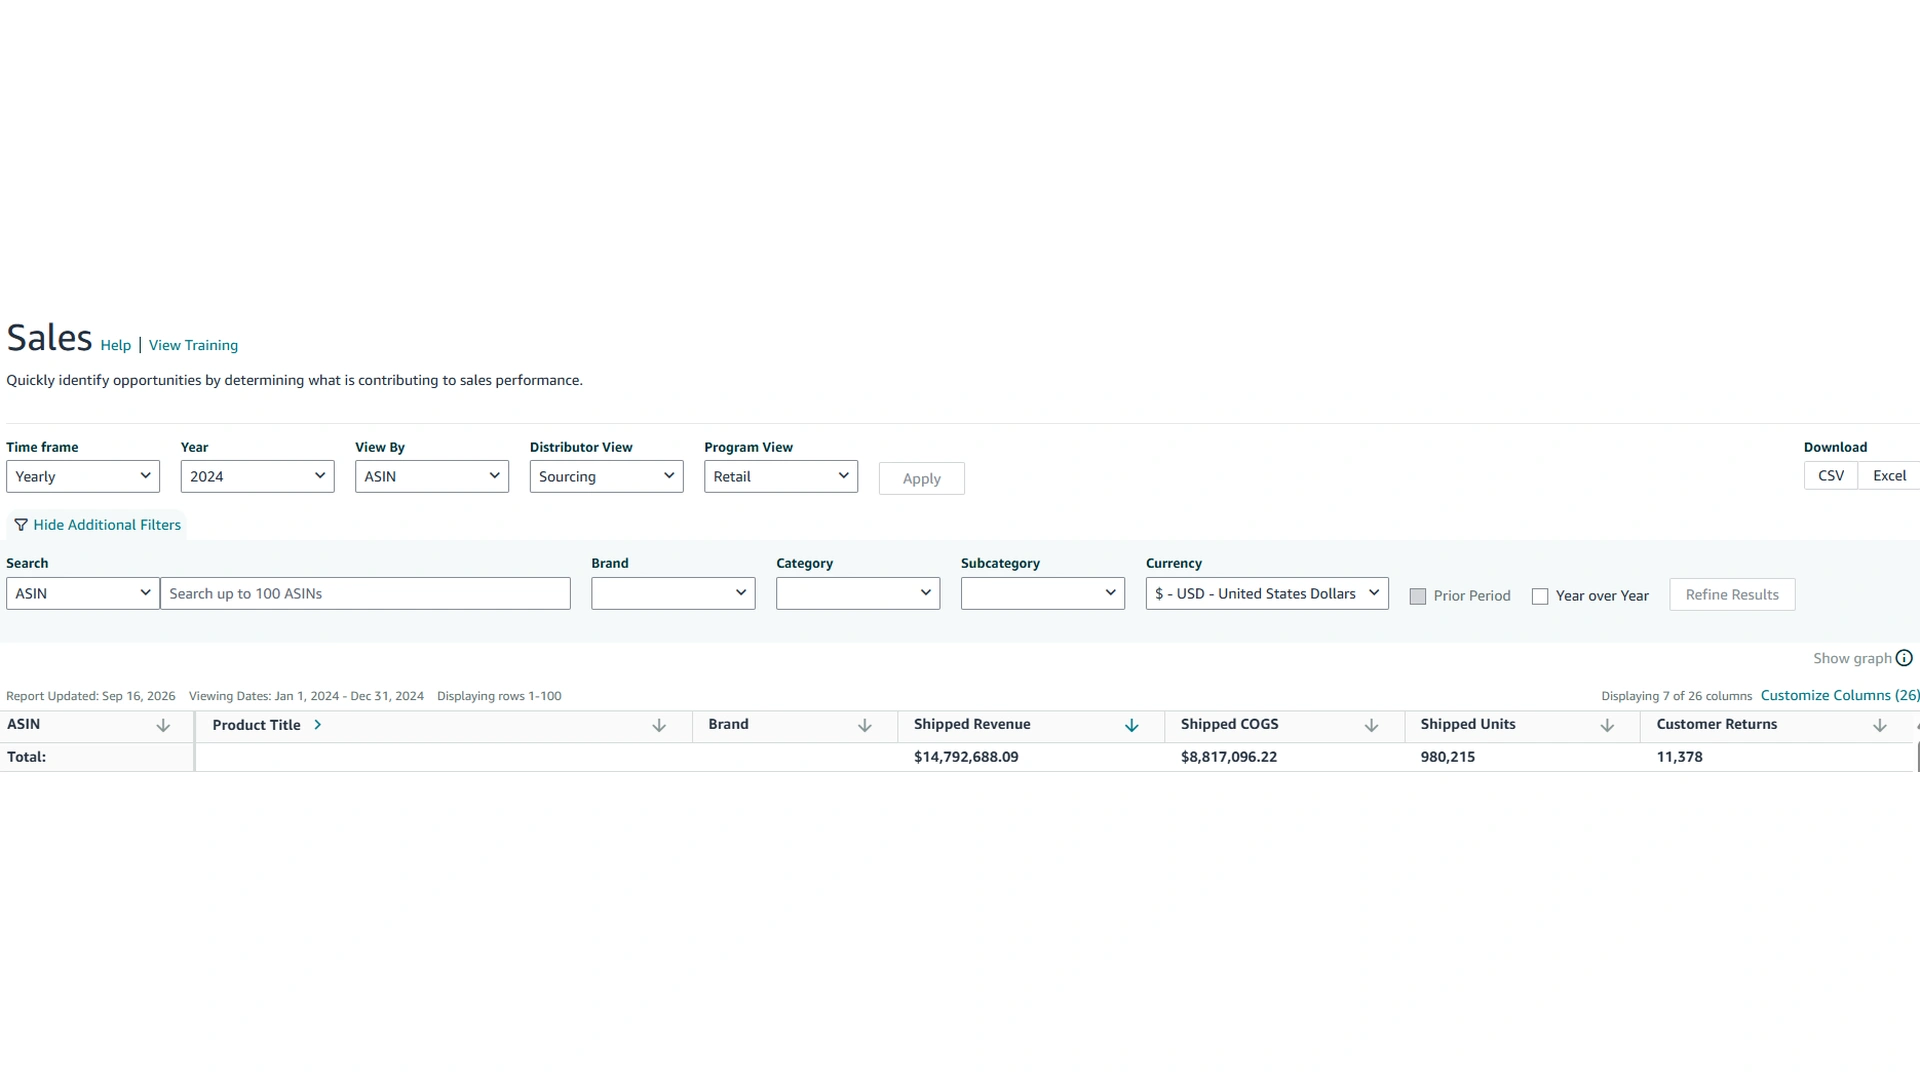
Performance was measured by comparing shipped revenue, page views, shipped COGS, and returns between the baseline and the improved performance period, with revenue increasing from $14.8M to $18.99M. The work covered 2024 to 2025.
In 2024 the account shipped 980,215 units for $14.79M, an average of $15.09 a unit at a 40.40% gross margin. Page views were climbing faster than the revenue they produced, which is a listing problem before it is a demand problem: shoppers were arriving and leaving. Returns stood at 11,378, or 1.16% of units shipped, and in beauty a return is the most expensive outcome there is. The unit ships, comes back, is inspected, is frequently unsellable afterwards, and the advertising that won the order is spent either way. The task was to convert more of the traffic already arriving, without buying the growth with price.
Beauty & Personal Care
Revenue was growing while the catalogue underneath worked against the brand.
Read the case study
Beauty & Personal Care
Six months of flat volume at an average order of $25.49.
Read the case study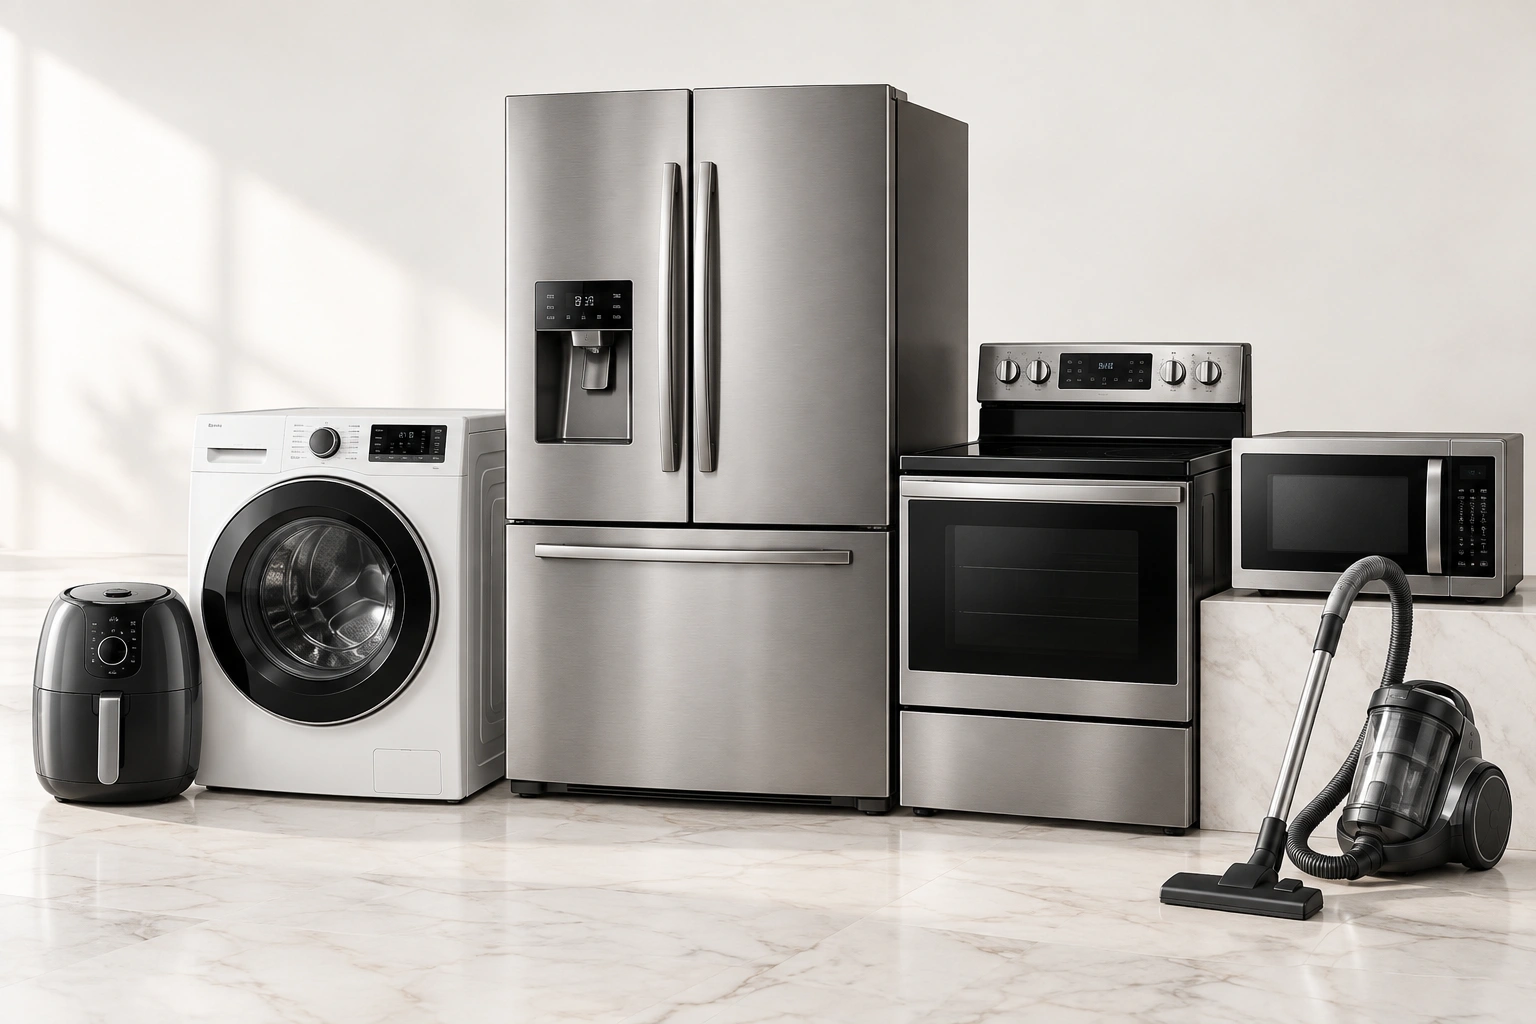
Home & Kitchenware
Google Ads scaling drove 236.13% sales growth and 211.36% more conversions.
Read the case study
Food & Beverage
Three campaigns, seventy orders a month, and bidding aimed at the wrong goal.
Read the case study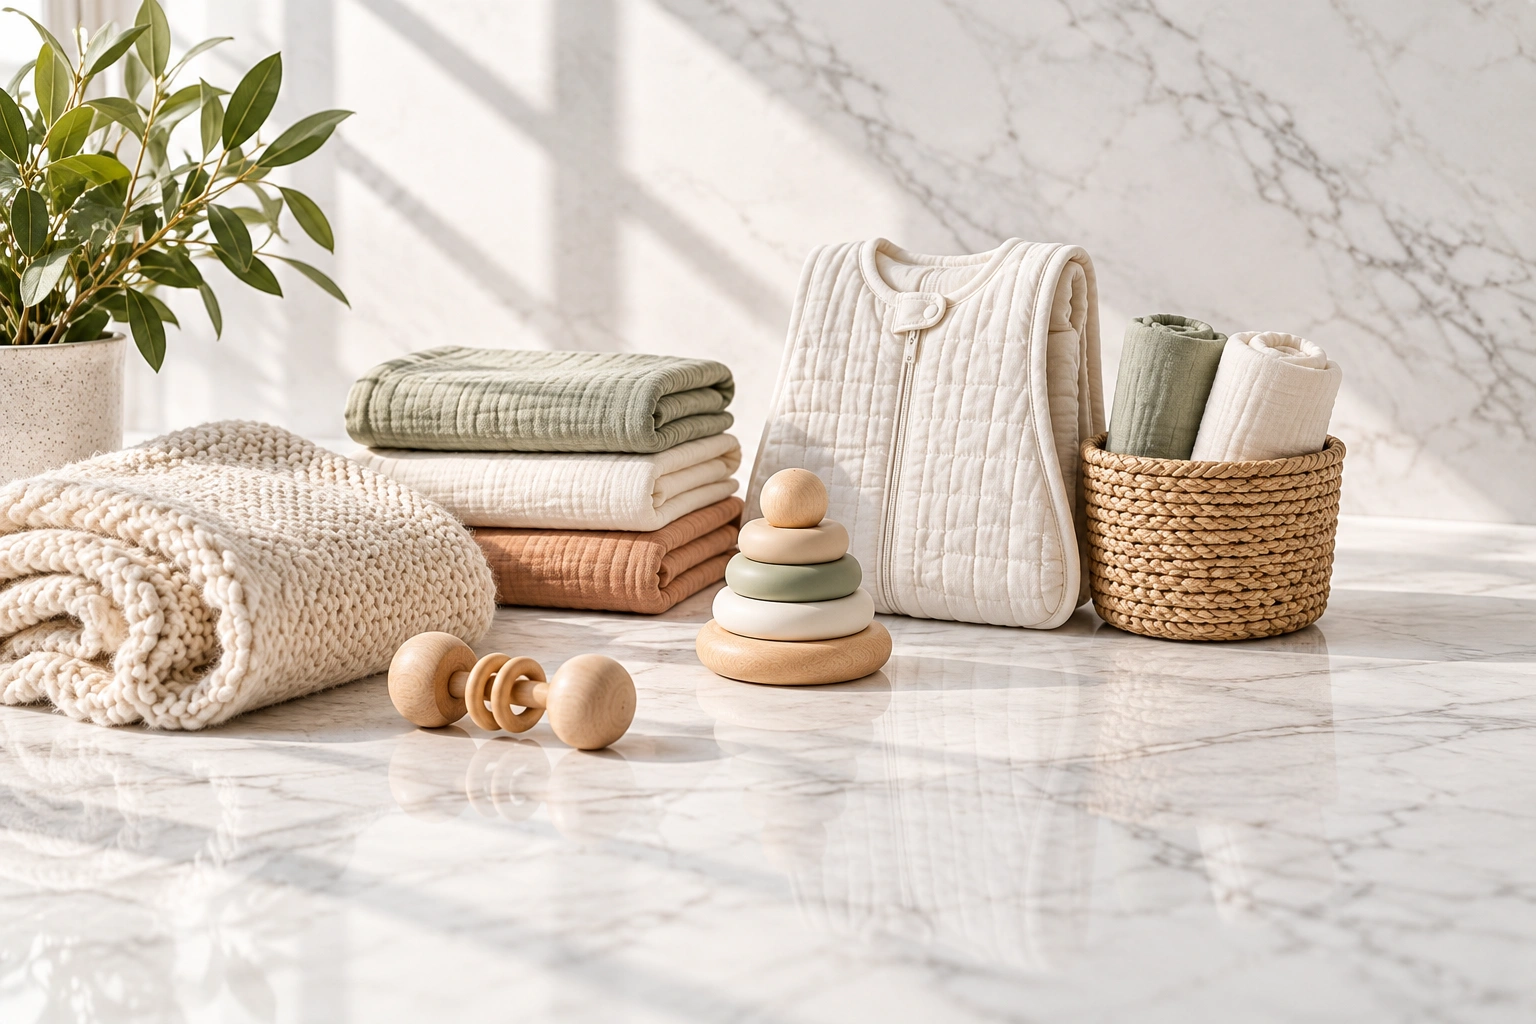
Baby & Kids
The whole catalogue competed for a budget of a few hundred pounds.
Read the case study
Health & Wellness
Two weeks of January carried the year, then the line fell away.
Read the case study
Health & Wellness
A high value catalogue grew on both order count and what each order was worth
Read the case study
Tools & Home Improvement
A twelve thousand order account grew without discounting its way there.
Read the case study
Baby & Kids
A premium range stopped being judged on its cheapest option.
Read the case study
Baby & Kids
January closed at 844 orders and $28,350.95 ($28.4K), and the account read as a
Read the case study
Sports & Outdoor
More frequent purchases from a catalogue built for one and done buying.
Read the case study
Office Products
At $19.17 an order there is no margin for an inefficient click, and February's
Read the case study
Food & Beverage
A mature account improved on the measure its monthly totals were hiding.
Read the case study
Clothing & Accessories
A range still finding its feet reached scale without cutting its price.
Read the case study
Baby & Kids
A stock up buying habit was already there and the range could not serve it.
Read the case study
Pet Supplies
A price held too long was tested, moved, and paid for itself in volume.
Read the case study
Health & Wellness
Three fewer trading days hid a month that was better than its total.
Read the case study
Food & Beverage
January is supposed to be the quiet month. This account grew through it.
Read the case study
Patio, Garden & Tools
A catalogue that had stopped trading was restored to service.
Read the case study
Toys & Games
A catalogue sold one item at a time started selling two.
Read the case study
Toys & Games
A range stopped meeting new buyers at its cheapest price.
Read the case study
Patio, Garden & Tools
The month after a record is usually where large accounts give it back.
Read the case study
Sports & Outdoor
A small account grew on volume and order value at the same time.
Read the case study
Electronics
A large account found volume in the places too small to bother with alone.
Read the case study
Clothing & Accessories
A wider range moved more units than the lower average order cost it.
Read the case study
Health & Wellness
An account that was really one product started selling like a catalogue.
Read the case study
Tools & Home Improvement
A brand converted more of the visitors it was already paying to attract.
Read the case study
Tools & Home Improvement
A profitable account whose only visible route to growth was a bigger budget.
Read the case study