+236.13% Revenue Growth Through Google Ads Scaling

Google Ads scaling drove 236.13% sales growth and 211.36% more conversions.

Home & Kitchenware · Apr to Sep 2026 · Published September 2026

Loading Home & Kitchenware banner
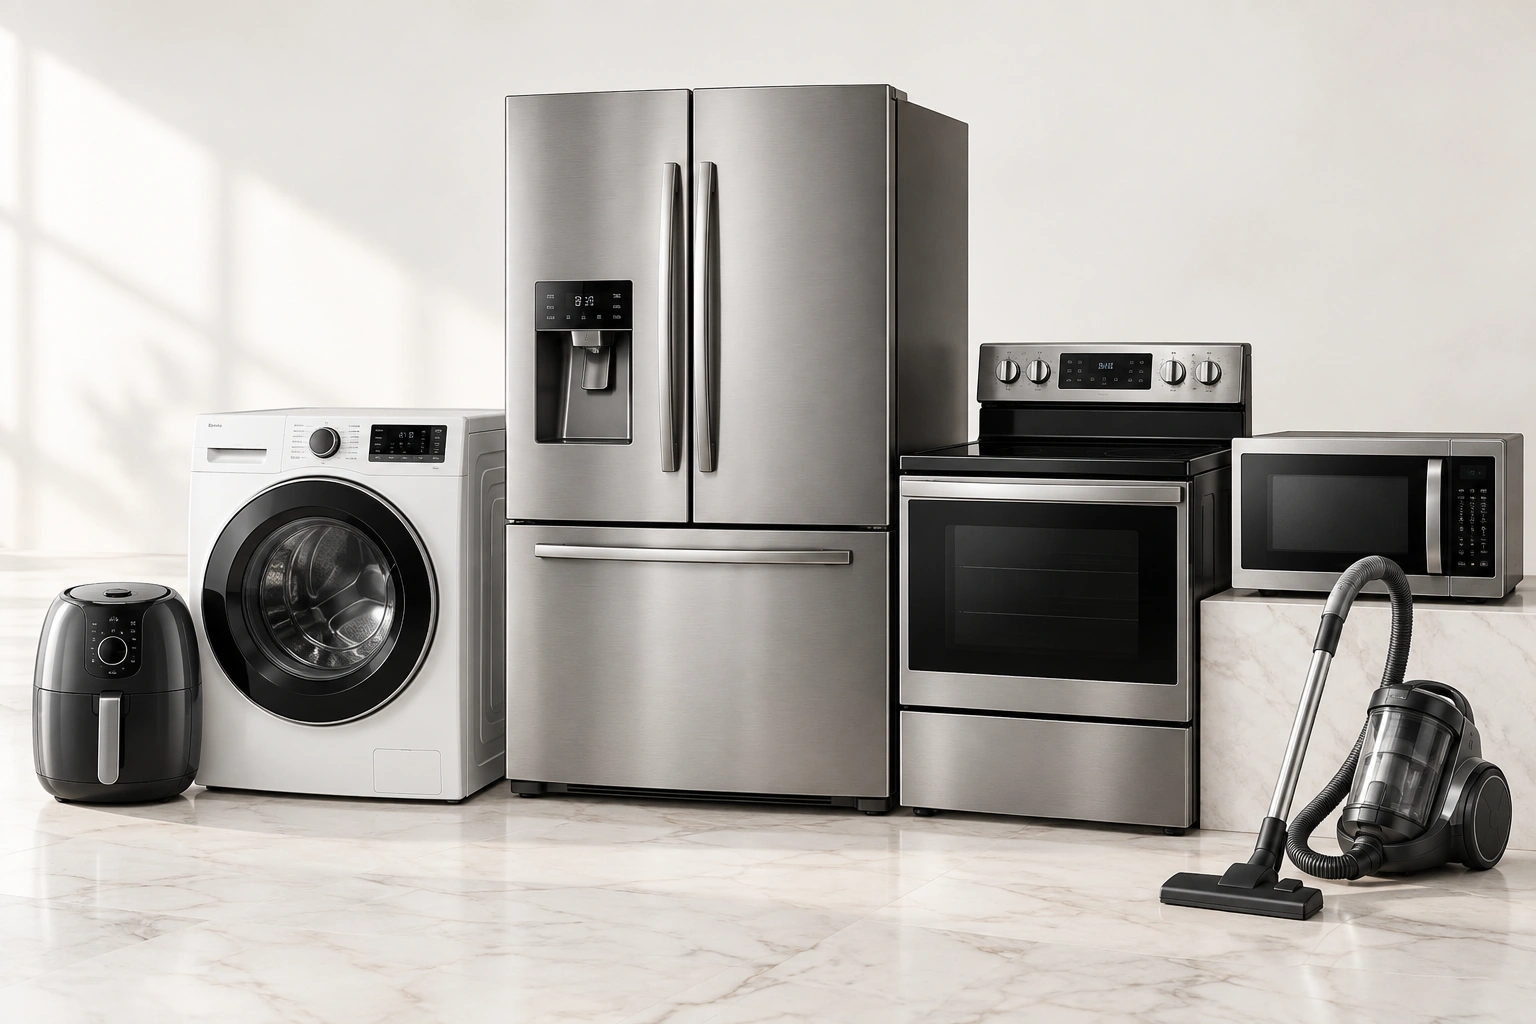
An air fryer, washing machine, fridge freezer, cooker, microwave and vacuum cleaner on a marble floor

The Numbers

Sales

$347.82K

from $103.47K

+236.16%

Ad Spend

$58.73K

from $23.64K

+148.43%

Conversions

5.48K

from 1.76K

+211.36%

ROAS

5.92

from 4.38

+35.16%

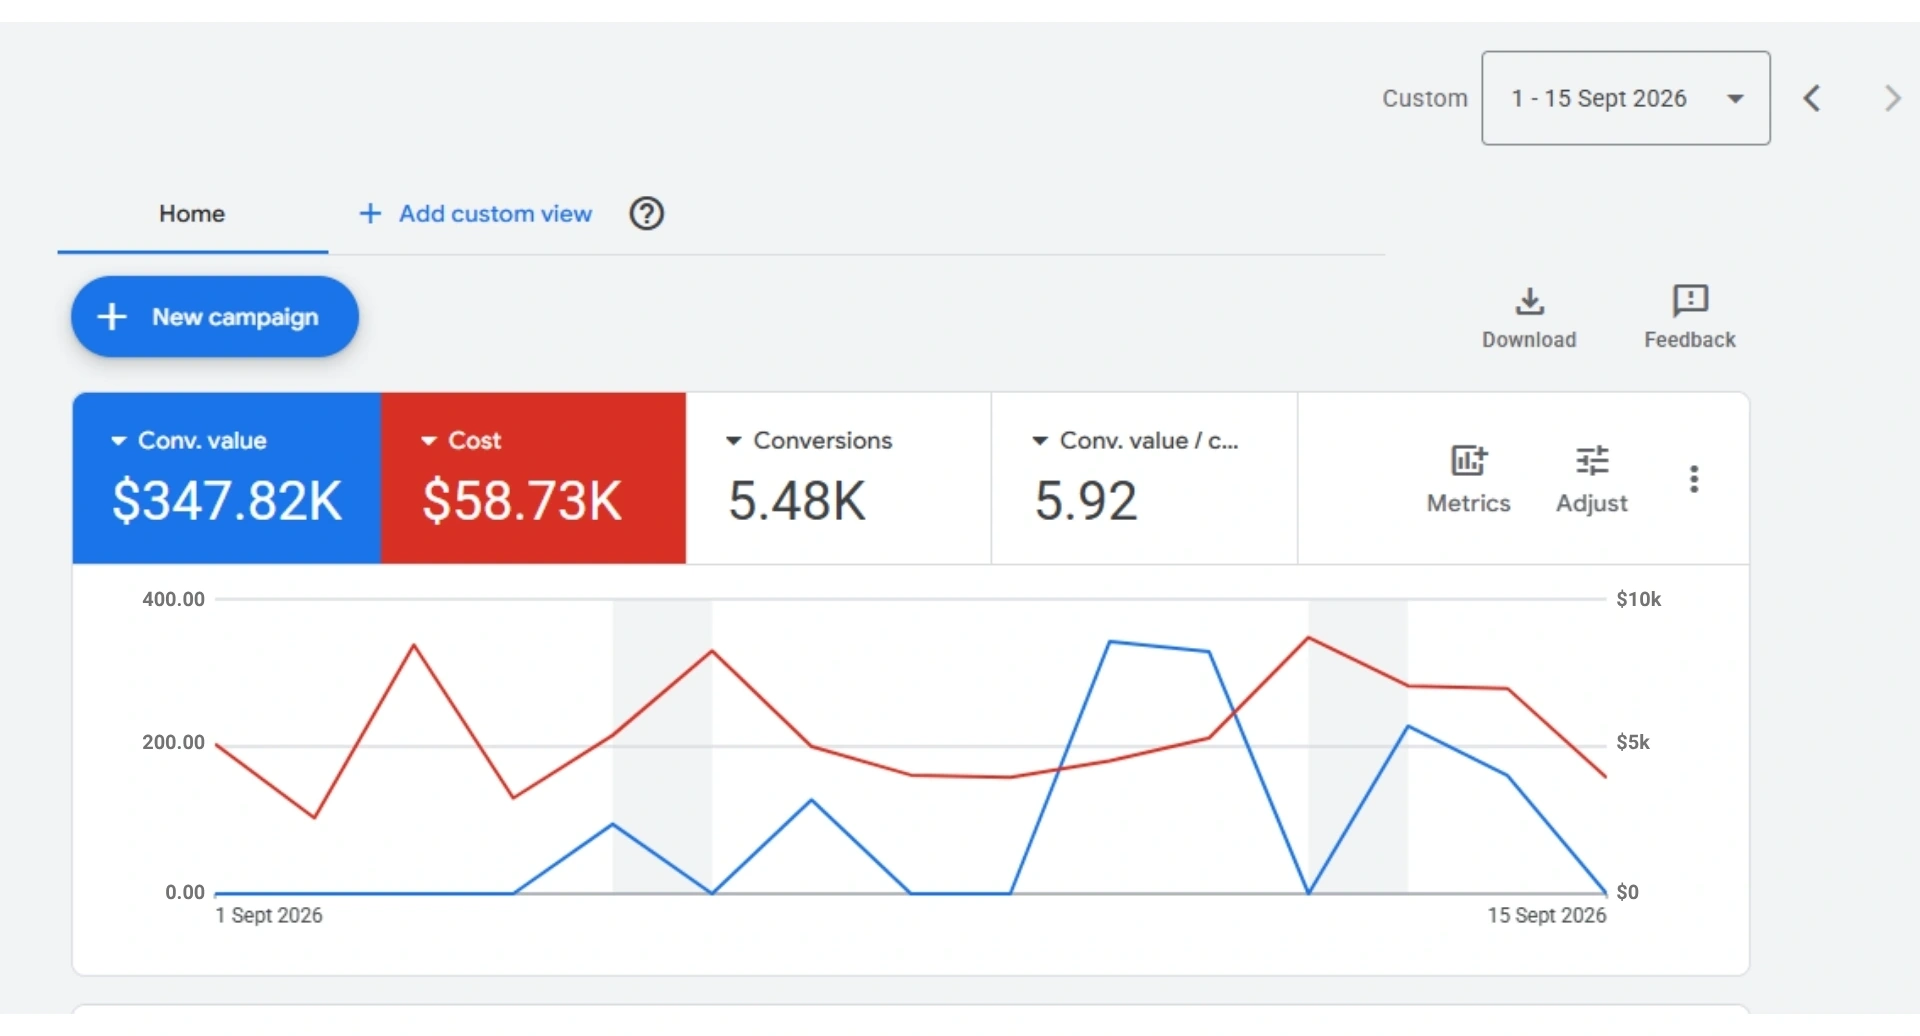
Performance was measured by comparing Google Ads sales, conversions, ad spend, and ROAS before and after the scaling period, using the Apr 1 to Apr 15, 2026 period as the baseline and Sep 1 to Sep 15, 2026 as the comparison period. The work covered Apr to Sep 2026.

The Challenge

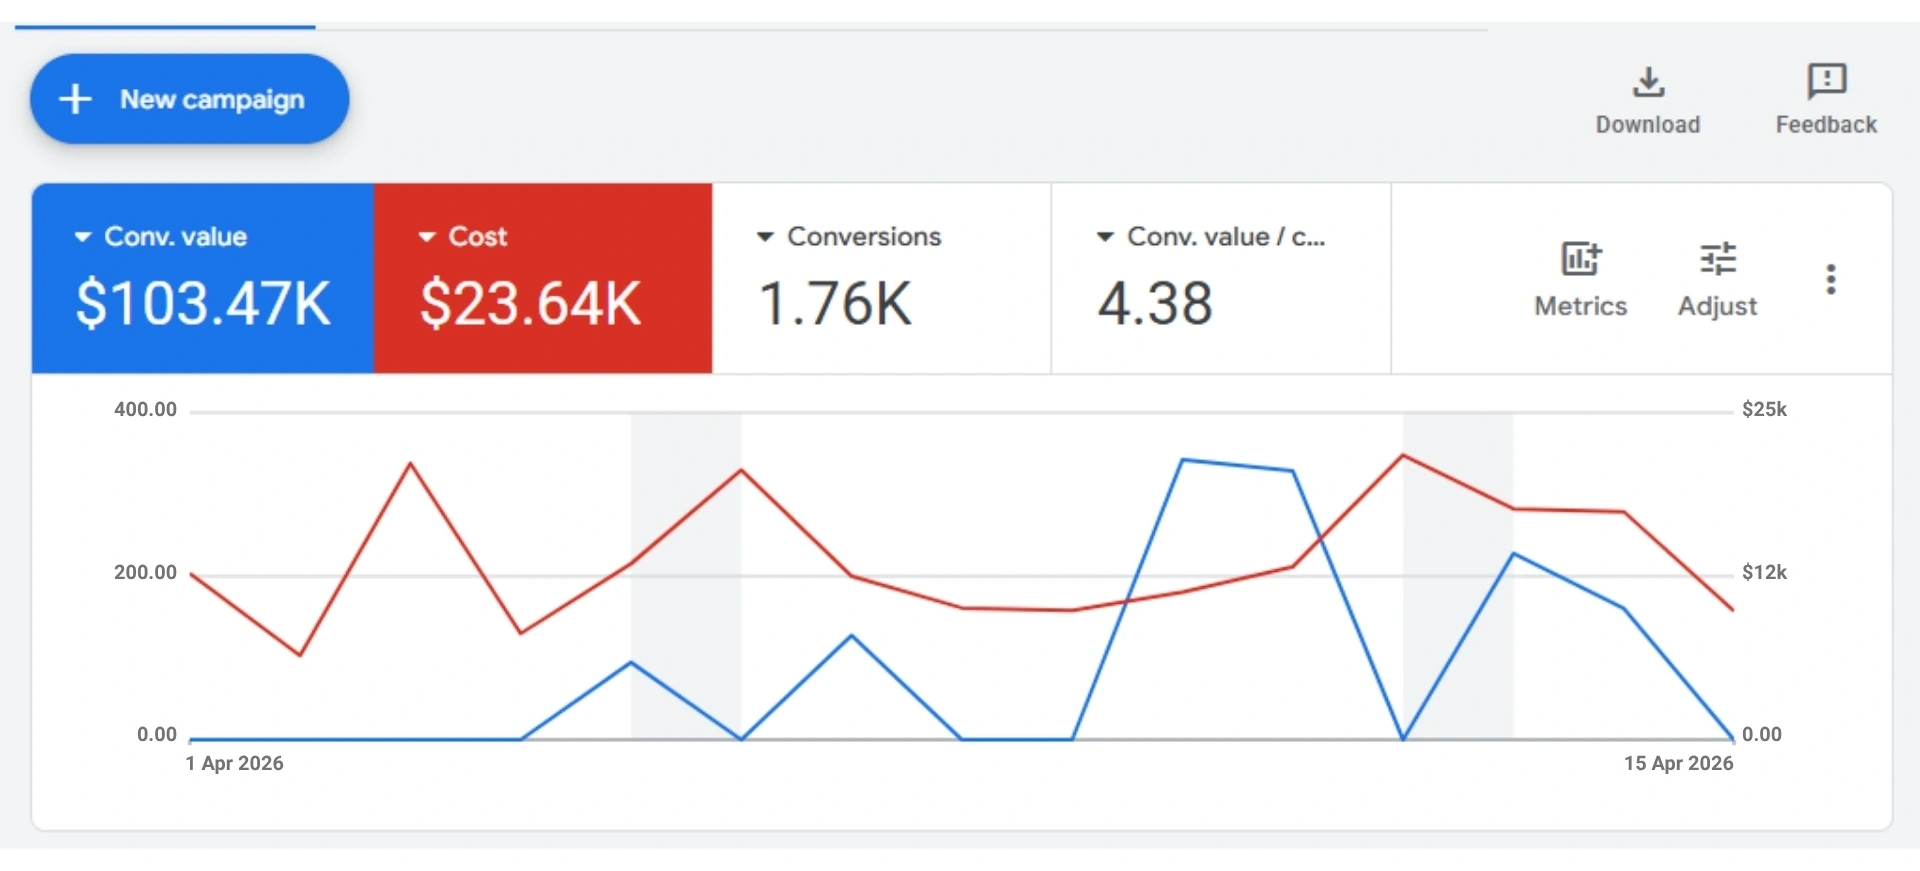
Between Apr 1 and Apr 15, 2026, the account generated $103.47K in sales with $23.64K in Google Ads spend, but growth had started to plateau around this level. The challenge was to significantly increase revenue within the same year while maintaining control over advertising efficiency. Simply increasing the budget was not enough. The account needed a structured approach to campaign optimization, budget allocation, conversion growth, and performance management to create a stronger foundation for scaling.
What We Changed

  • Shifted the Google Ads strategy from maintaining existing performance toward scalable revenue growth.
  • Increased advertising investment from $23.64K to $58.73K, with budget expansion guided by campaign performance and scaling potential.
  • Reallocated budget toward campaigns and traffic sources with stronger commercial potential and greater capacity to generate incremental revenue.
  • Analyzed conversions, conversion value, spend, and Conversion Value / Cost together to identify where additional investment could generate stronger returns.
  • Focused on increasing conversion volume while maintaining disciplined control over advertising efficiency.
  • Scaled budgets progressively based on performance rather than increasing spend indiscriminately across the account.
  • Continuously monitored campaign performance and adjusted budget allocation to support the strongest growth opportunities.

The Outcome

  • Sales increased from $103.47K to $347.82K, representing a 236.13% increase.
  • Conversions increased from 1.76K to 5.48K, representing a 211.36% increase.
  • Conversion Value / Cost improved from 4.38x to 5.92x, representing a 35.16% improvement in efficiency.
  • Google Ads spend increased from $23.64K to $58.73K, supporting the additional revenue scale.
  • The account moved beyond its previous growth ceiling and reached $347.82K in sales during the Sep 1 to Sep 15, 2026 period.

Press Enter to open the one in view full size.

More Case Studies

  • Modern home furnishings styled in a bright room for a Google Ads case study.

    Home & Kitchenware

    Learn more

    +42.86%Revenue From Google Ads

    Google Ads spent every day of January, but sold on almost none of the first 18.

  • Value-Based Bidding Lifted Google Ads Revenue 29.50%: case study banner

    Food & Beverage

    Learn more

    +29.50%Revenue on a Sub-£2K UK Budget

    Three campaigns, seventy orders a month, and bidding aimed at the wrong goal.

  • Google Ads Revenue Rose 46.53% While Spend Fell 16%: case study banner

    Baby & Kids

    Learn more

    46.53%More Revenue, 16% Less Spend

    The whole catalogue competed for a budget of a few hundred pounds.

  • More Work on Real Accounts

    Every study we have published, across categories and marketplaces: the situation, the work and the numbers it moved.

Want Results Like This for Your Brand?

Tell us where you are now and we will tell you what we would change first, before you commit to anything.